In some cases the use of the modeled IRF in SPCImage does not result in satisfactory results. This is usually the case when the model function does not fit the real IRF well. Such deviations appear if the detector IRF exhibits special shape features, such as a diffusion tail with SPADs or secondary peaks with MCP detectors. In addition, many diode lasers produce a secondary peak in the IRF if operated at higher power.
In any of theses cases incorporation of a measured IRF in FLIM data analysis can provide more stable results and increase consistency across measurement series with different IRFs. This article describes how to extract an IRF from measured data and use it for FLIM data analysis in SPCImage. The procedure is easy as it requires only few clicks. Yet, a valid IRF measurement must be available.
Short version (tl;dr)
- Start SPCImage and load the .sdt file with measured IRF into SPCImage: File -> Import
- Select a pixel with a curve which contains IRF data. Increase the binning parameter to add more photons to the curve.
In some cases you can also use the LOCK icon in the icon bar to bin all pixels together. - In the decay view window use the black cursors to select the relevant part of the curve. All values outside the cursors will be set to zero.
- Select: IRF -> Copy from decay data
Now you should see that in the decay window the green line overlays exactly the blue dots (measured data) within the cursor range. - Select: IRF -> Copy to Clipboard
- Open another instance of SPCImage and import your measured FLIM data from an .sdt file which you want to analyse.
- Select: IRF -> Paste from clipboard
- Now run your FLIM analysis as usual
To learn more go on with reading below.
Long version
The very first step is, of course, to measure the IRF on your instrument. There multiple ways to do this, i.e. measure scattering, quenched fluorescence, SHG and others. Yet there is no single universal way to do this for all instruments. Please see the section “IRF Recording” on page 446 in the bh TCSPC hanbdbook. For this section we assume that a valid IRF has been performed and is a available as a .sdt file.
Open IRF measurement and extract IRF
- Start SPCImage and load the .sdt file with measured IRF into SPCImage: File -> Import
- Select a pixel with a curve which contains IRF data. Increase the binning parameter to add more photons to the curve.
- In some cases you can also use the LOCK icon in the icon bar to bin all pixels together.
- In the decay view window use the black cursors to select the relevant part of the curve. All values outside the cursors will be set to zero.
In the example shown below an SHG signal from urea crystals was recorded on a 2-photon FLIM microscope. After increasing the binning one can see one main peak and a few weak secondary peaks resulting from parasitic reflections. We use the black cursors in the decay view window to isolate the main peak which we want to use as the IRF. Note that at this stage SPCImage is not aware of our plans. SPCImage still tries to model a synthetic IRF (green line) and fit the SHG data with a fluorescence decay model (red line).
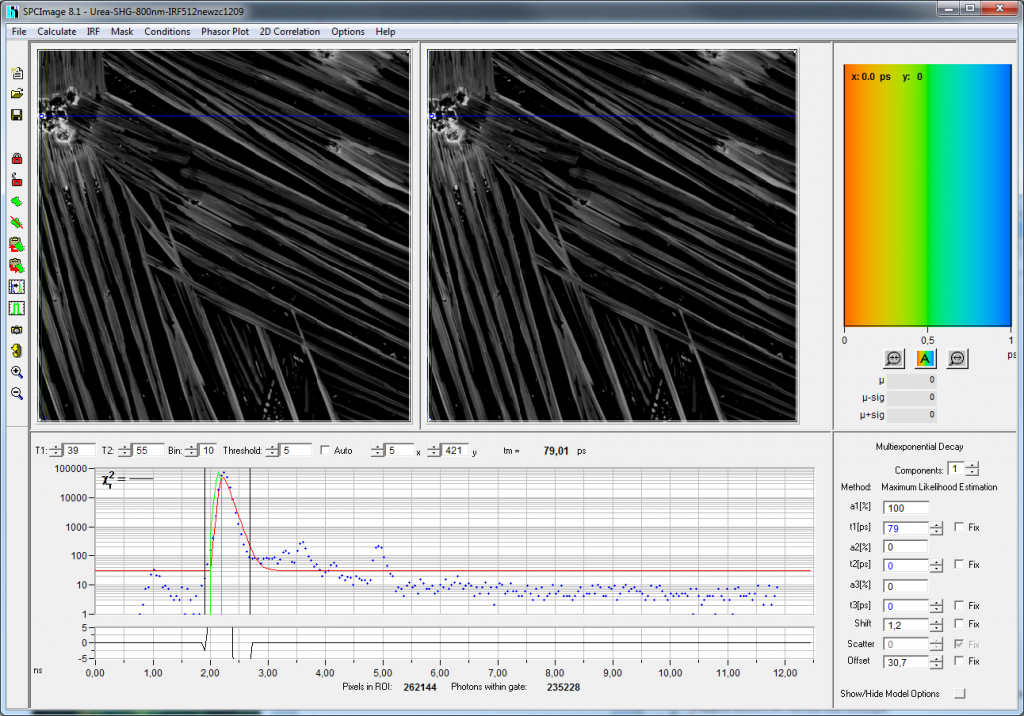
Once the correct range is selected using black cursors we need to tell SPCImage that it should declare the measured data (blue dots) to be the IRF. To do so, we tell SPCImage to take the IRF from measured data in the menu bar:
4. Select: IRF -> Copy from decay data
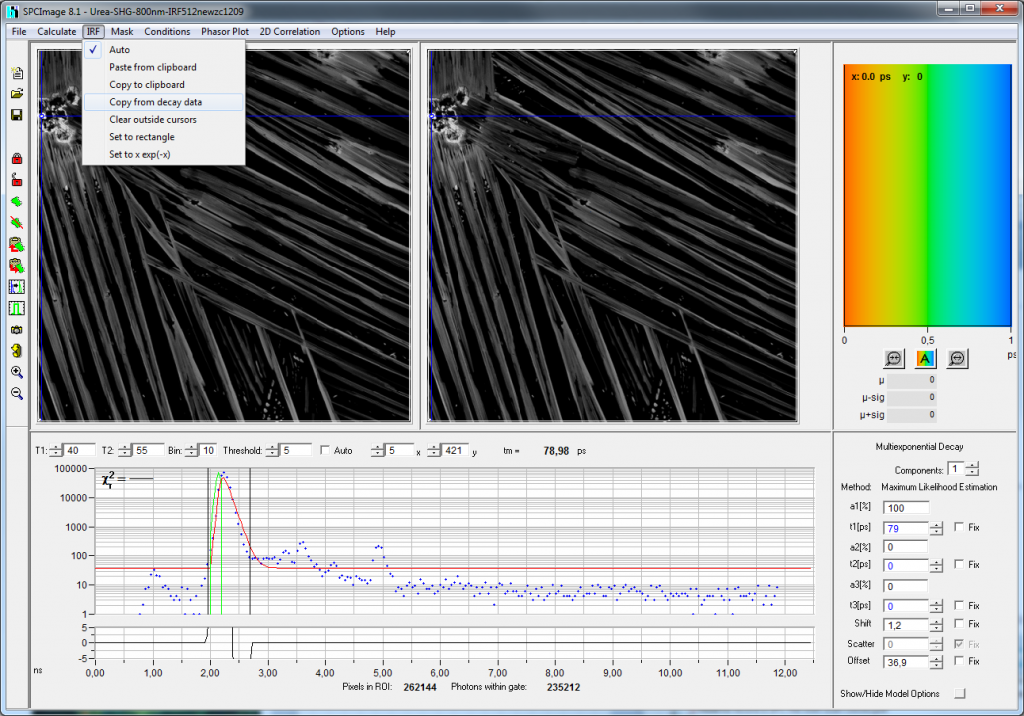
Now you should see that in the decay window the green line overlays exactly the blue dots (measured data) within the cursor range. Note that now SPCImage automatically tries to fit the data with the new IRF with the fit hitting the lowest lifetime value set in model options.
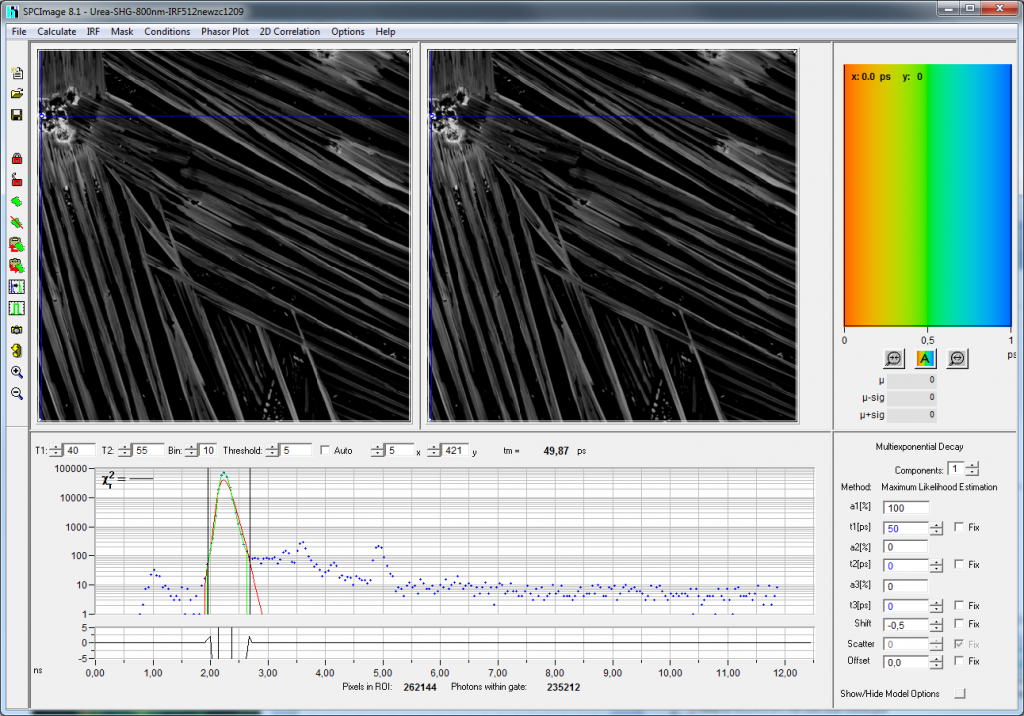
As the final step we need to copy the new IRF to clipboard:
5. Select: IRF -> Copy to Clipboard
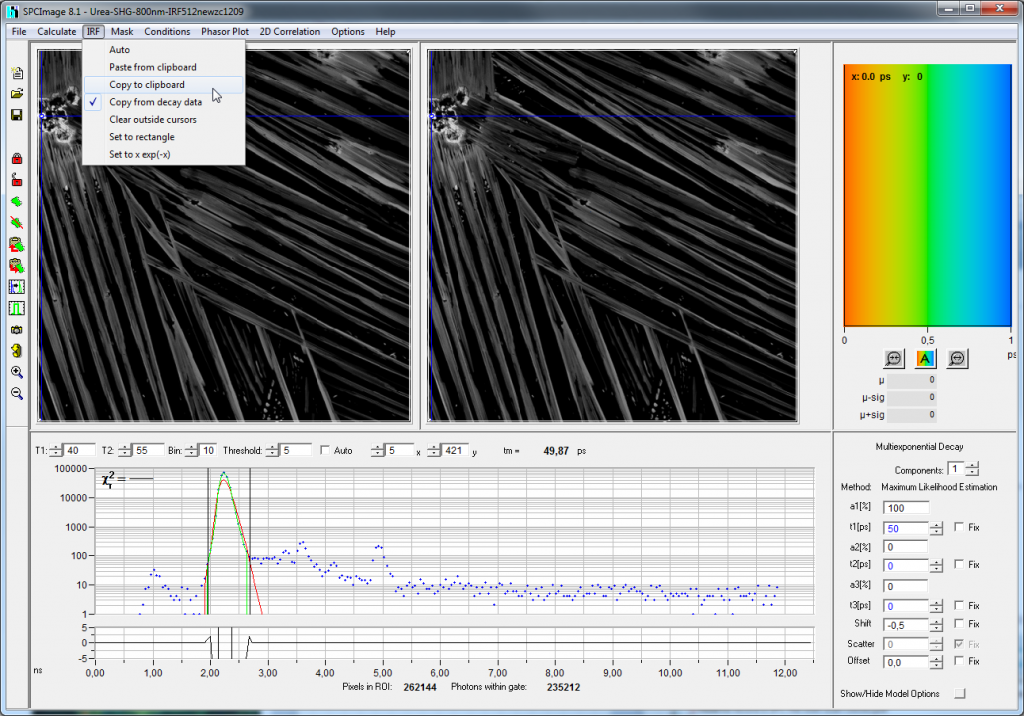
Now the IRF data is in the clipboard and can be pasted anywhere (see below for details).
Use the IRF for the actual FLIM measurement
To incorporate the extracted IRF in the actual analysis we need to load the FLIM data set and paste the IRF. Usually, one will launch another instance of SPCImage and import the .sdt file with the FLIM measurement: File -> Import
Now past the IRF from the clipboard into the current data set:
7. Select: IRF -> Paste from clipboard
Now run your FLIM analysis as usual. The new IRF will now be used for fitting the fluorescence decay curves.
Tips & tricks
Since SPCImage uses the clipboard to store the IRF and the data format is just a vector of photon numbers it is very easy to “play around” with the IRF. One can also use own model functions to see the effects onto the analysis.
Anywhere it goes …
After copying the IRF to the clipboard of your computer you can easily paste into any other software. For example paste and check the data in notepad:
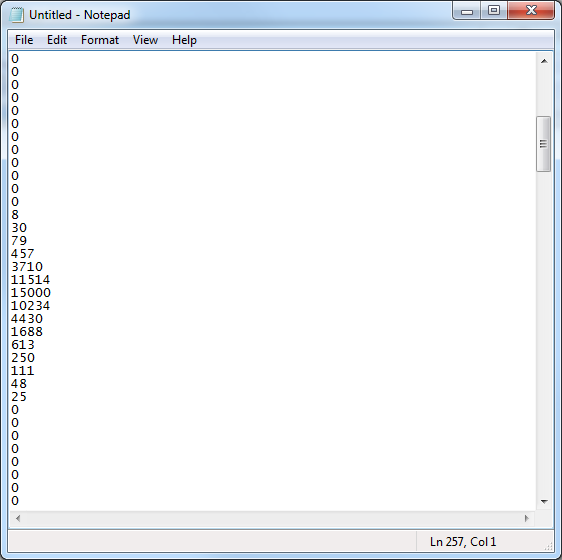
The data format consists of just integer values arranged as a column vector. The number of entries is equals to the number of points the fluorescence decay curve, i.e. ADC resolution in SPCM. Already here you can simply change values by hand (keep the integer format and the number of lines) and copy&paste it back to SPCImage. You can save the data as a simple text file if you want to keep track of different IRFs you have tried or if you want to import it into another software.
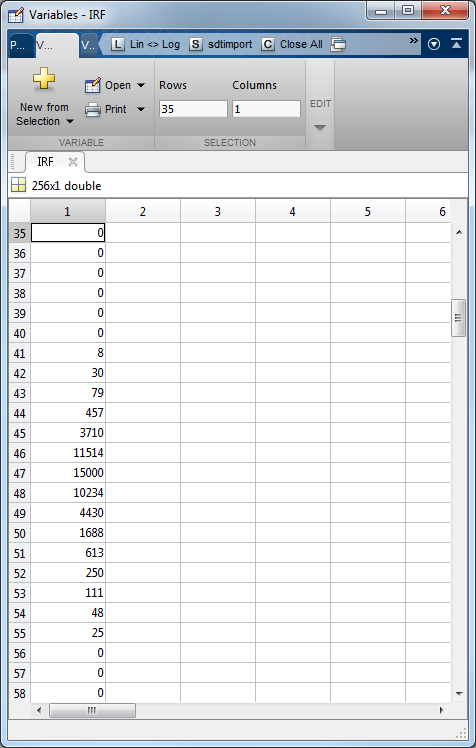
If you use Matlab you can easily paste the data in the Variable Editor. First create a new variable on the command line:
IRF=0;
Then open the variable in the variable editor and paste the data which you have copied previously in SPCImage:
… wherever it comes from
If have modified or modeled the IRF in another software you can paste into SPCImage from the clipboard by selecting: IRF -> Paste from clipboard
The only thing you have the care about: the values must be integer values (no comma, no dots) and the length of the vector must match your current data set. The best practice is to copy the modeled IRF from SPCImage and use it for comparison or as a template.
