
- Combination of Time-Domain and Phasor Analysis
- Maximum-Likelihood Fit
- GPU Processing
- Calculation of FLIM Images within less than 1 second
- Single, Double, Triple-Exponential Models
- Incomplete-Decay Models
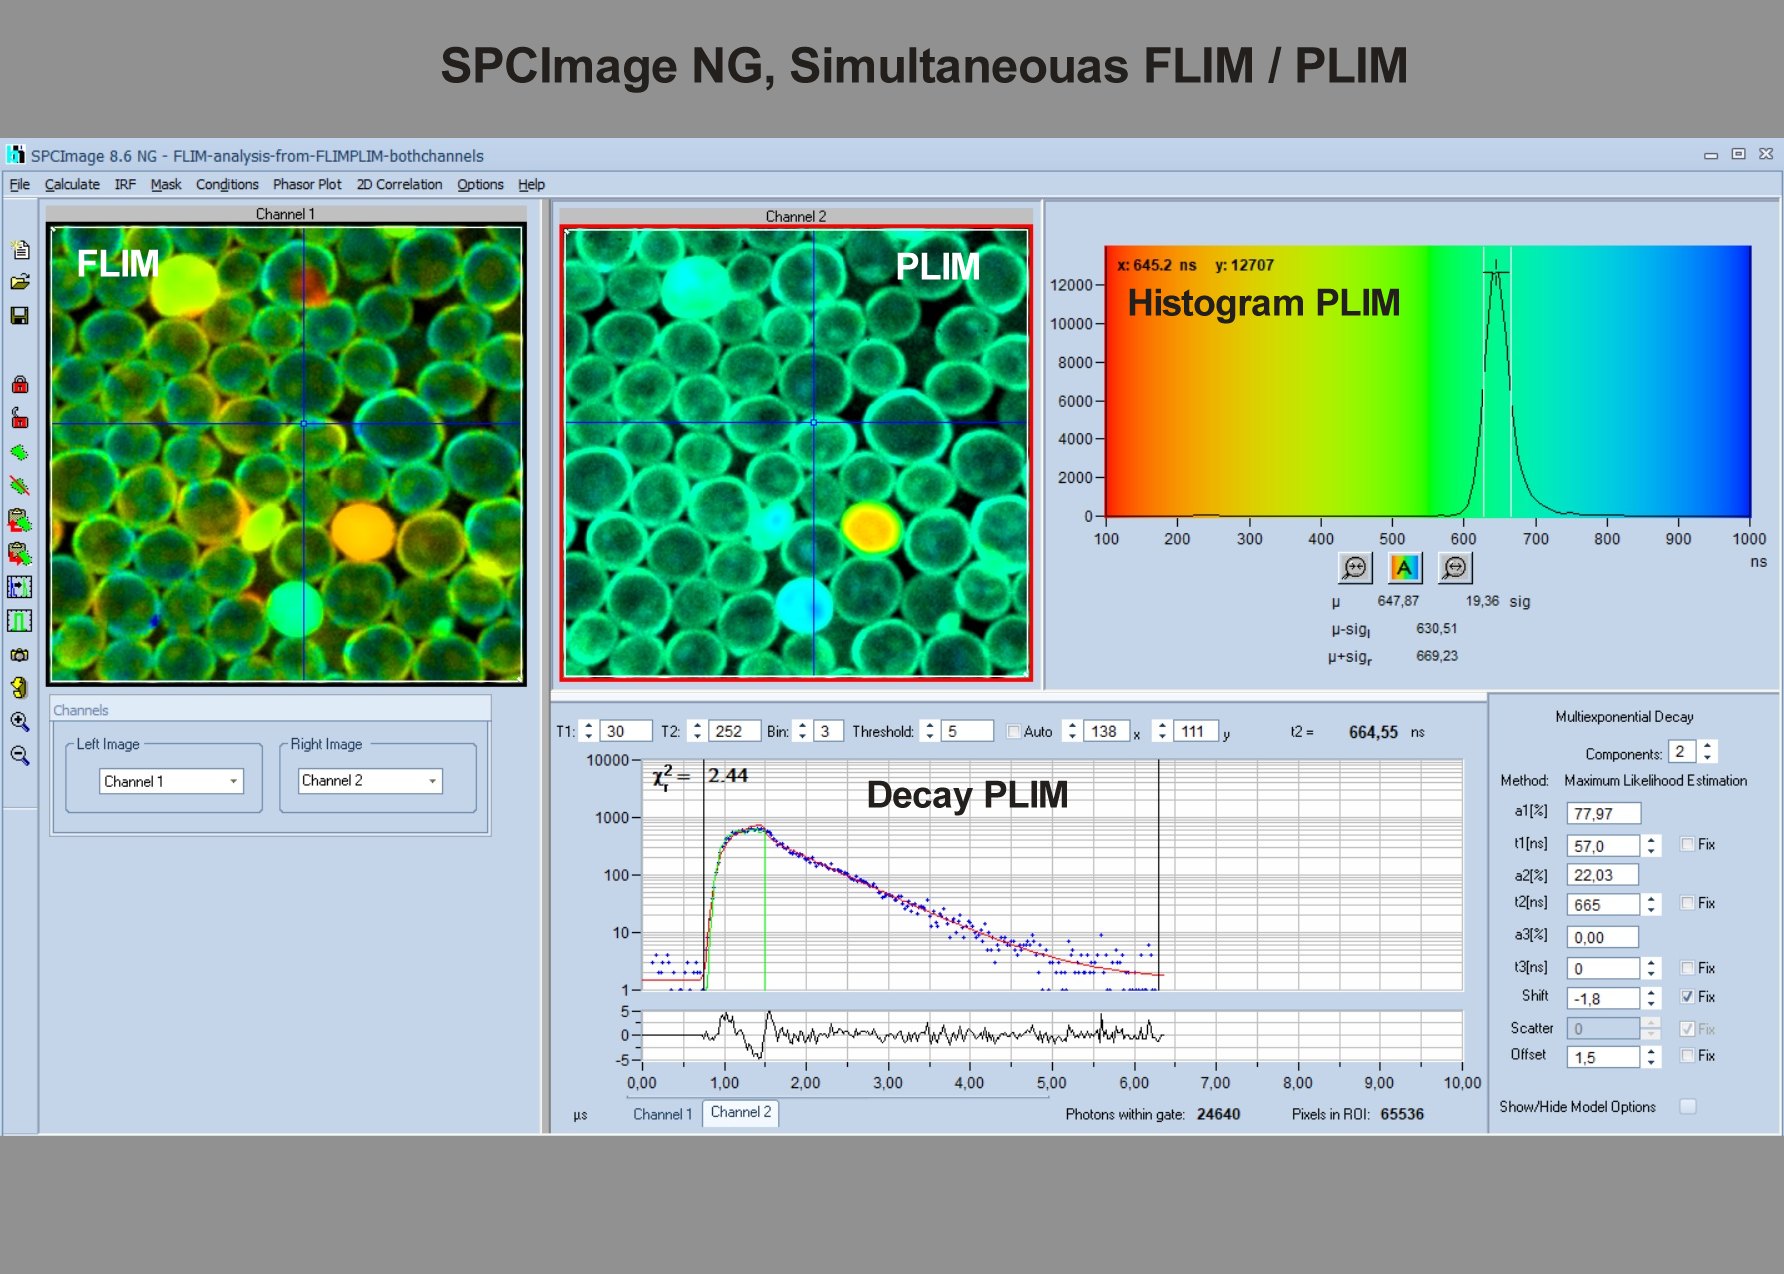
- Analysis of Single Decay Curves, FLIM Data and PLIM Data
- Calculation and Display of Lifetimes, Amplitudes, Fractional Intensities
- Calculation and Display of Ratios of Decay Parameters
- Calculation and Display of FRET Efficiencies
- One- and Two-Dimensional Histograms of Decay Parameters
- Batch Processing
- Export of Lifetime Data and Images
Please see The bh TCSPC handbook, chapter 'SPCImage NG Data Analysis Software' and SPCImage NG Overview Brochure.
SPCImage NG Requires a Valid Licence to Run.
Description
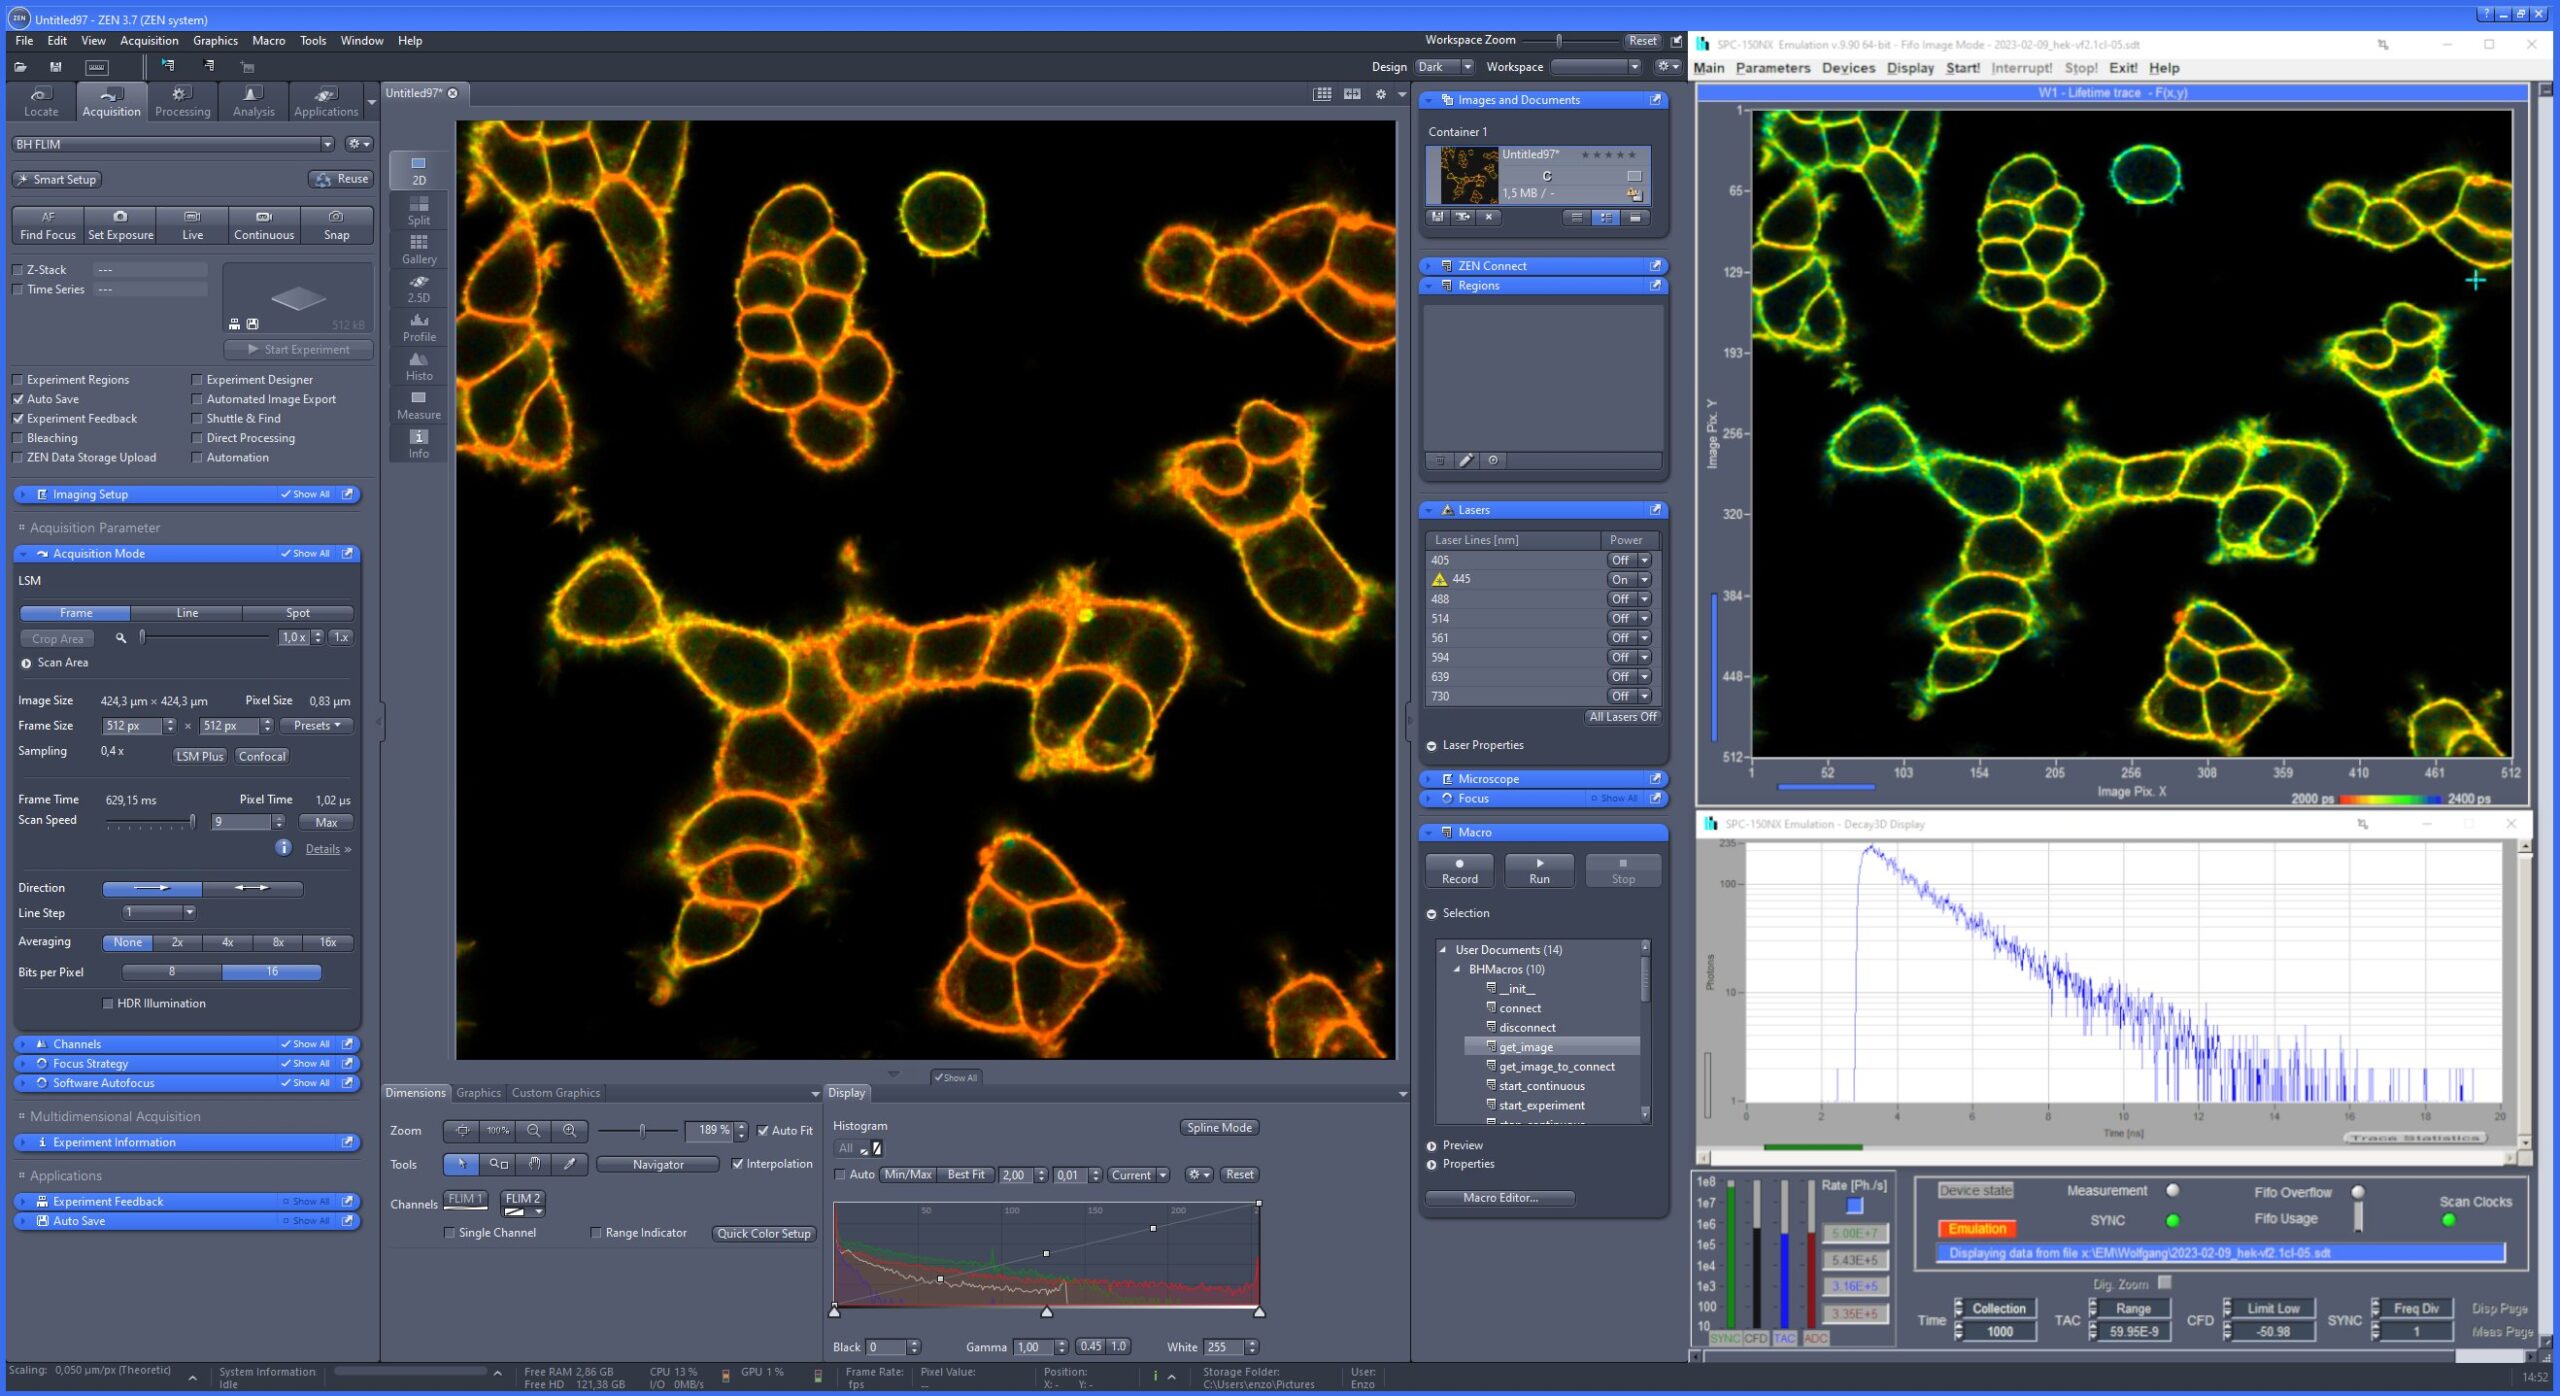
The ‘SPCImage NG’ software is used for fluorescence decay analysis. SPCImage NG can be used both for TCSPC Imaging (FLIM and PLIM) data, and for single-curve fluorescence decay analysis. The SPCImage NG software is integrated in the bh TCSPC software package. There is a direct link from the SPCM software to SPCImage NG.
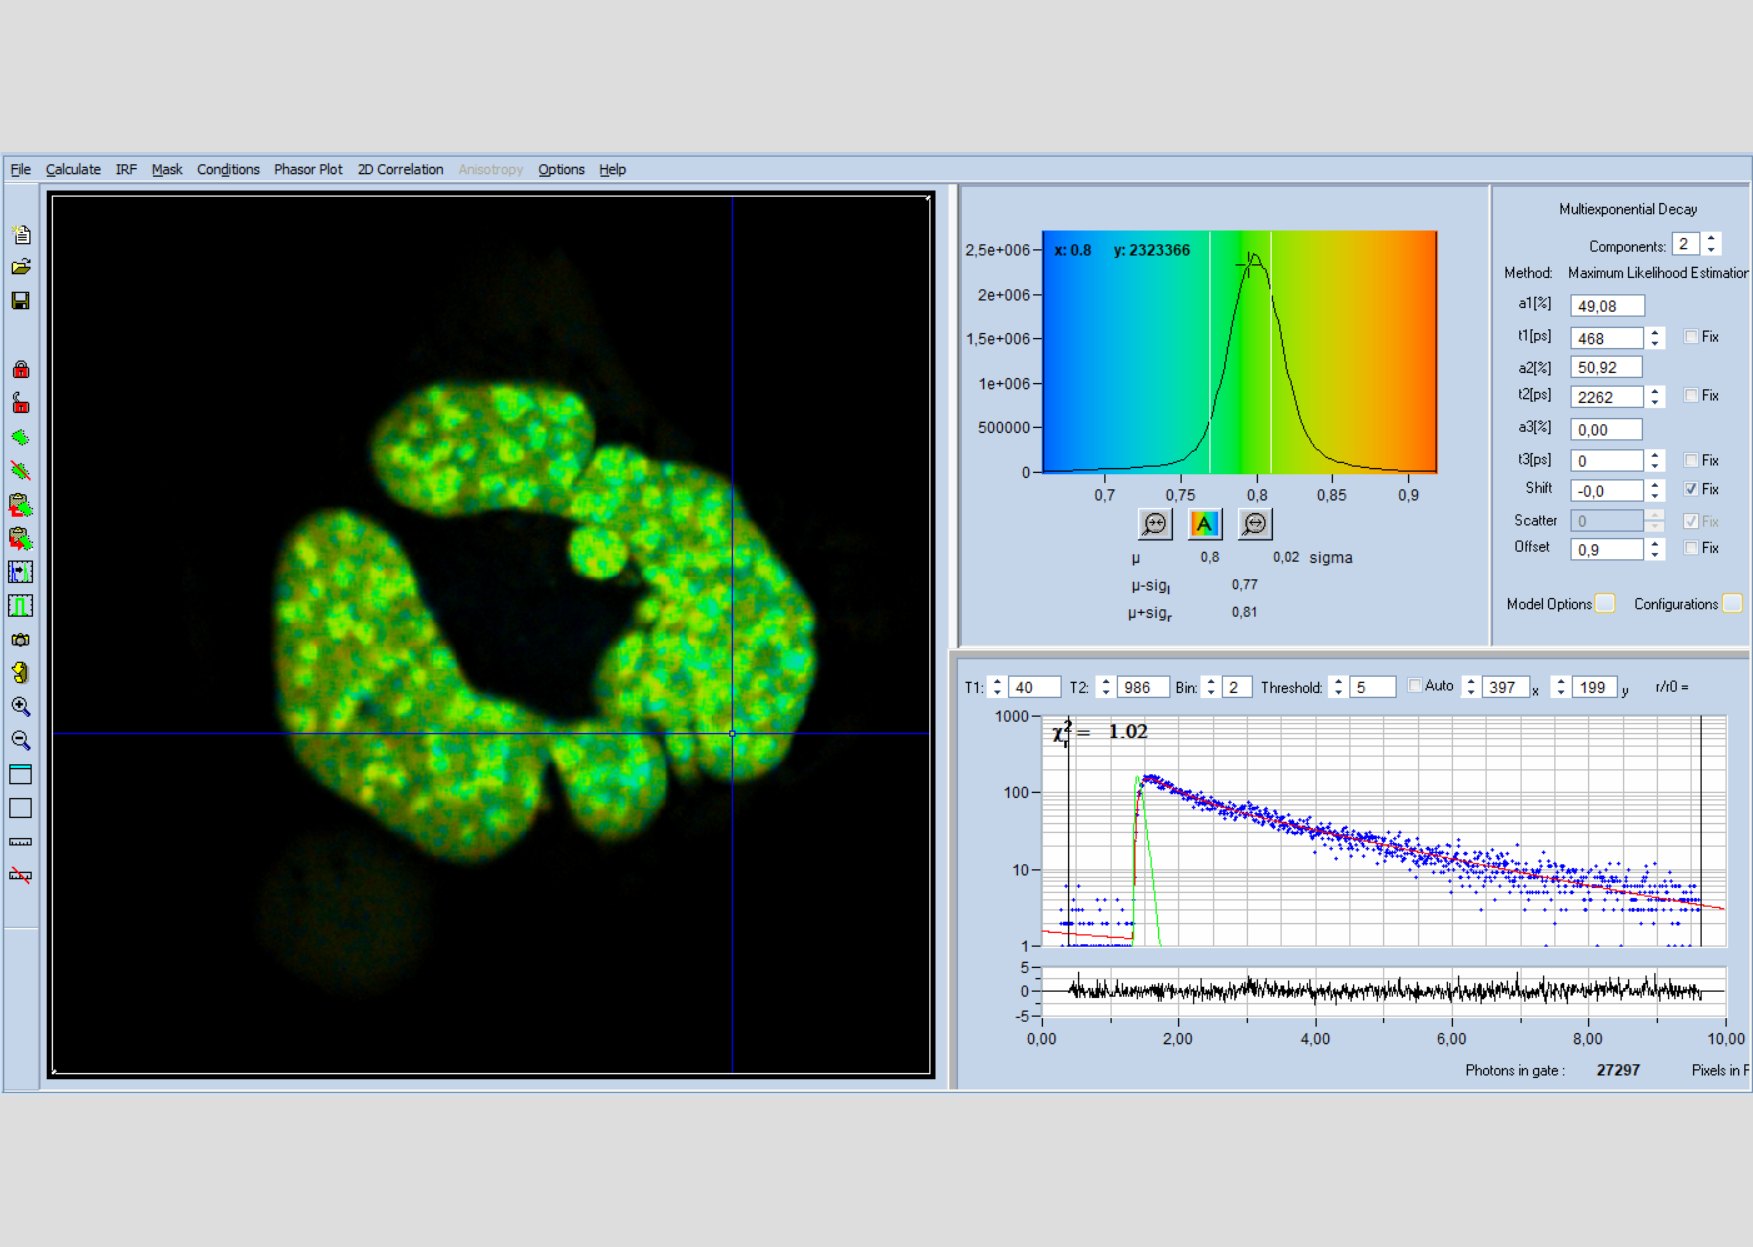
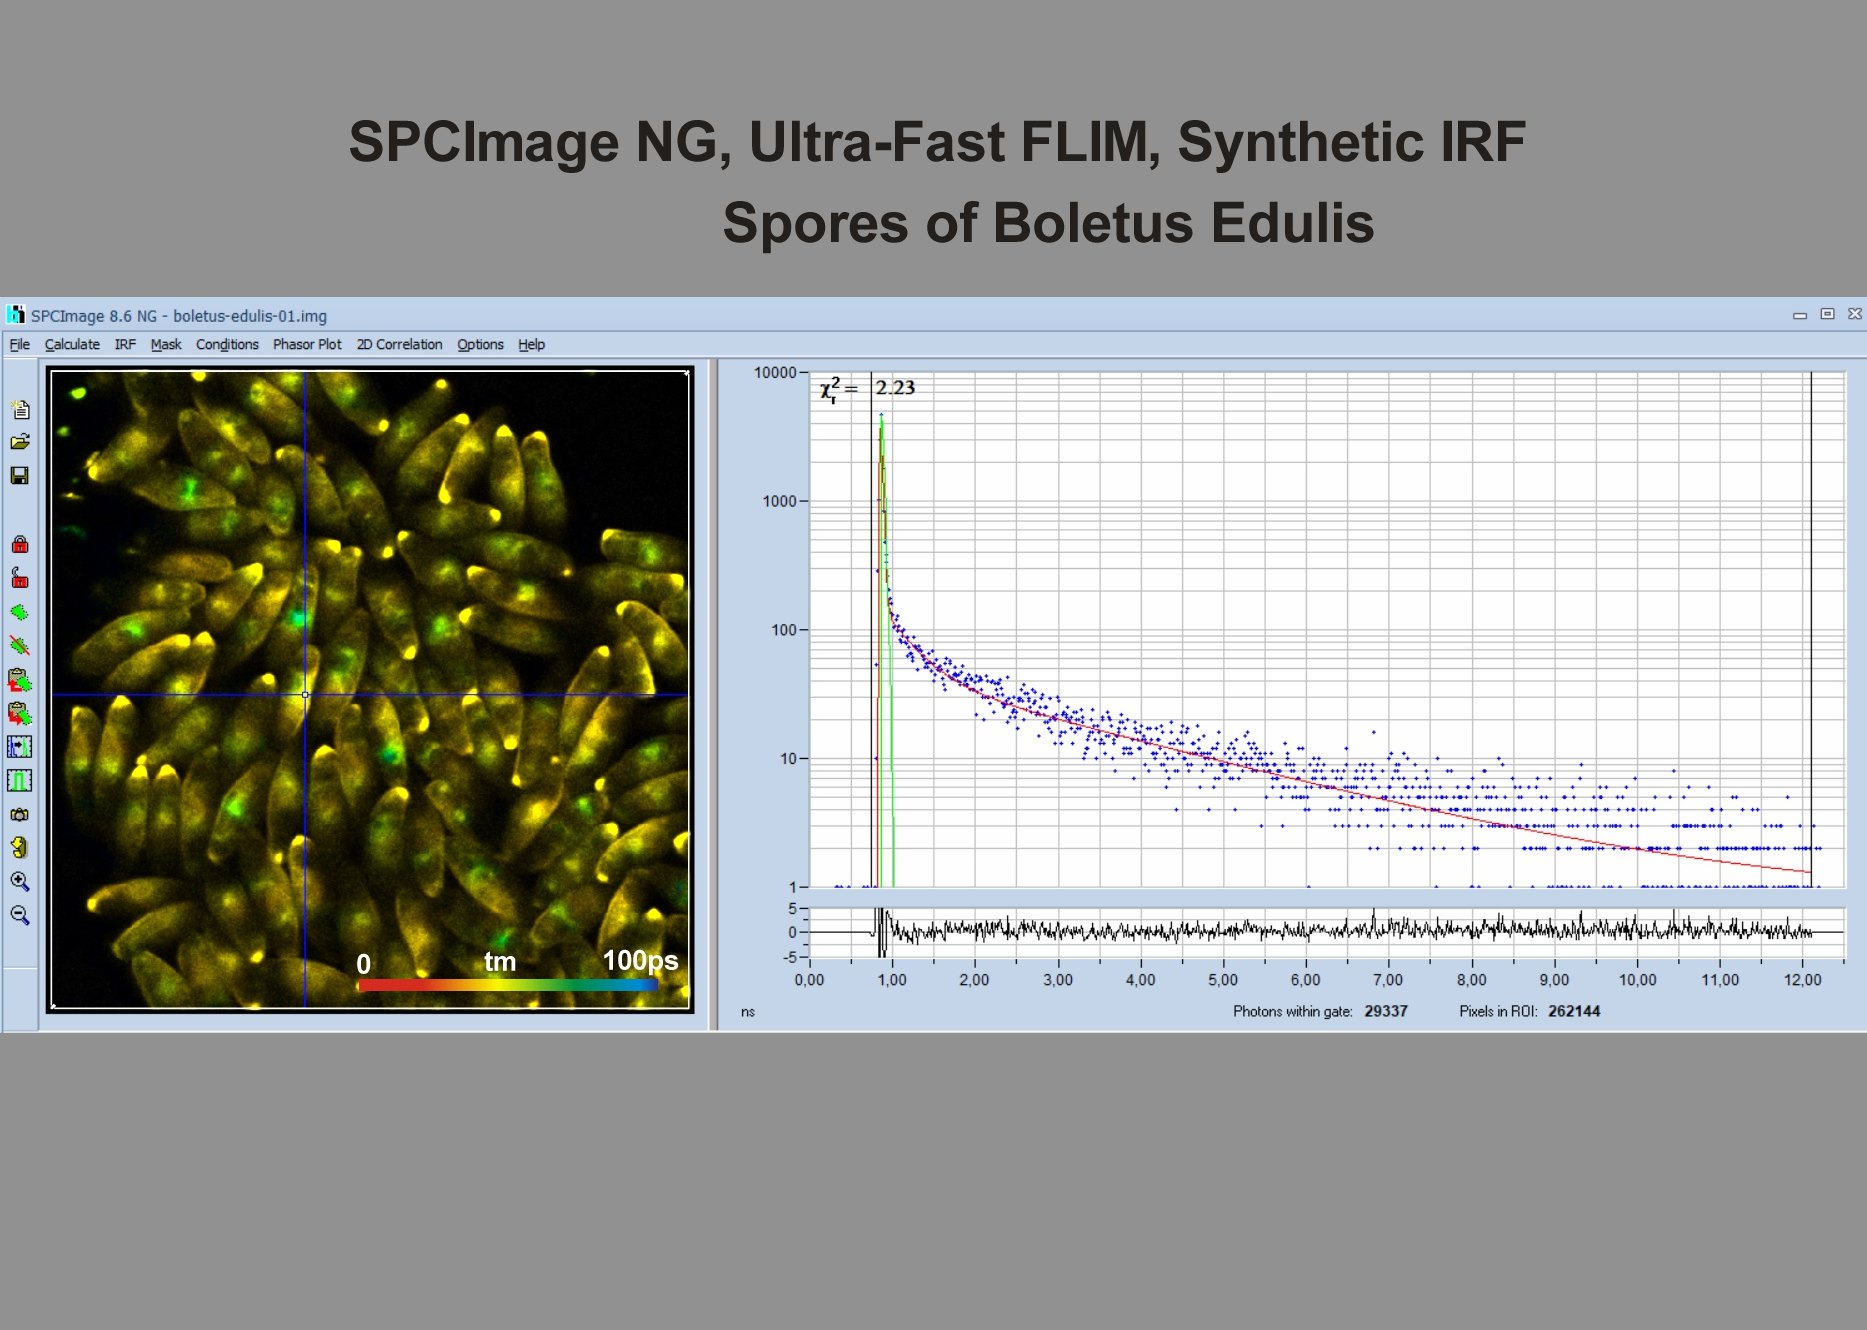
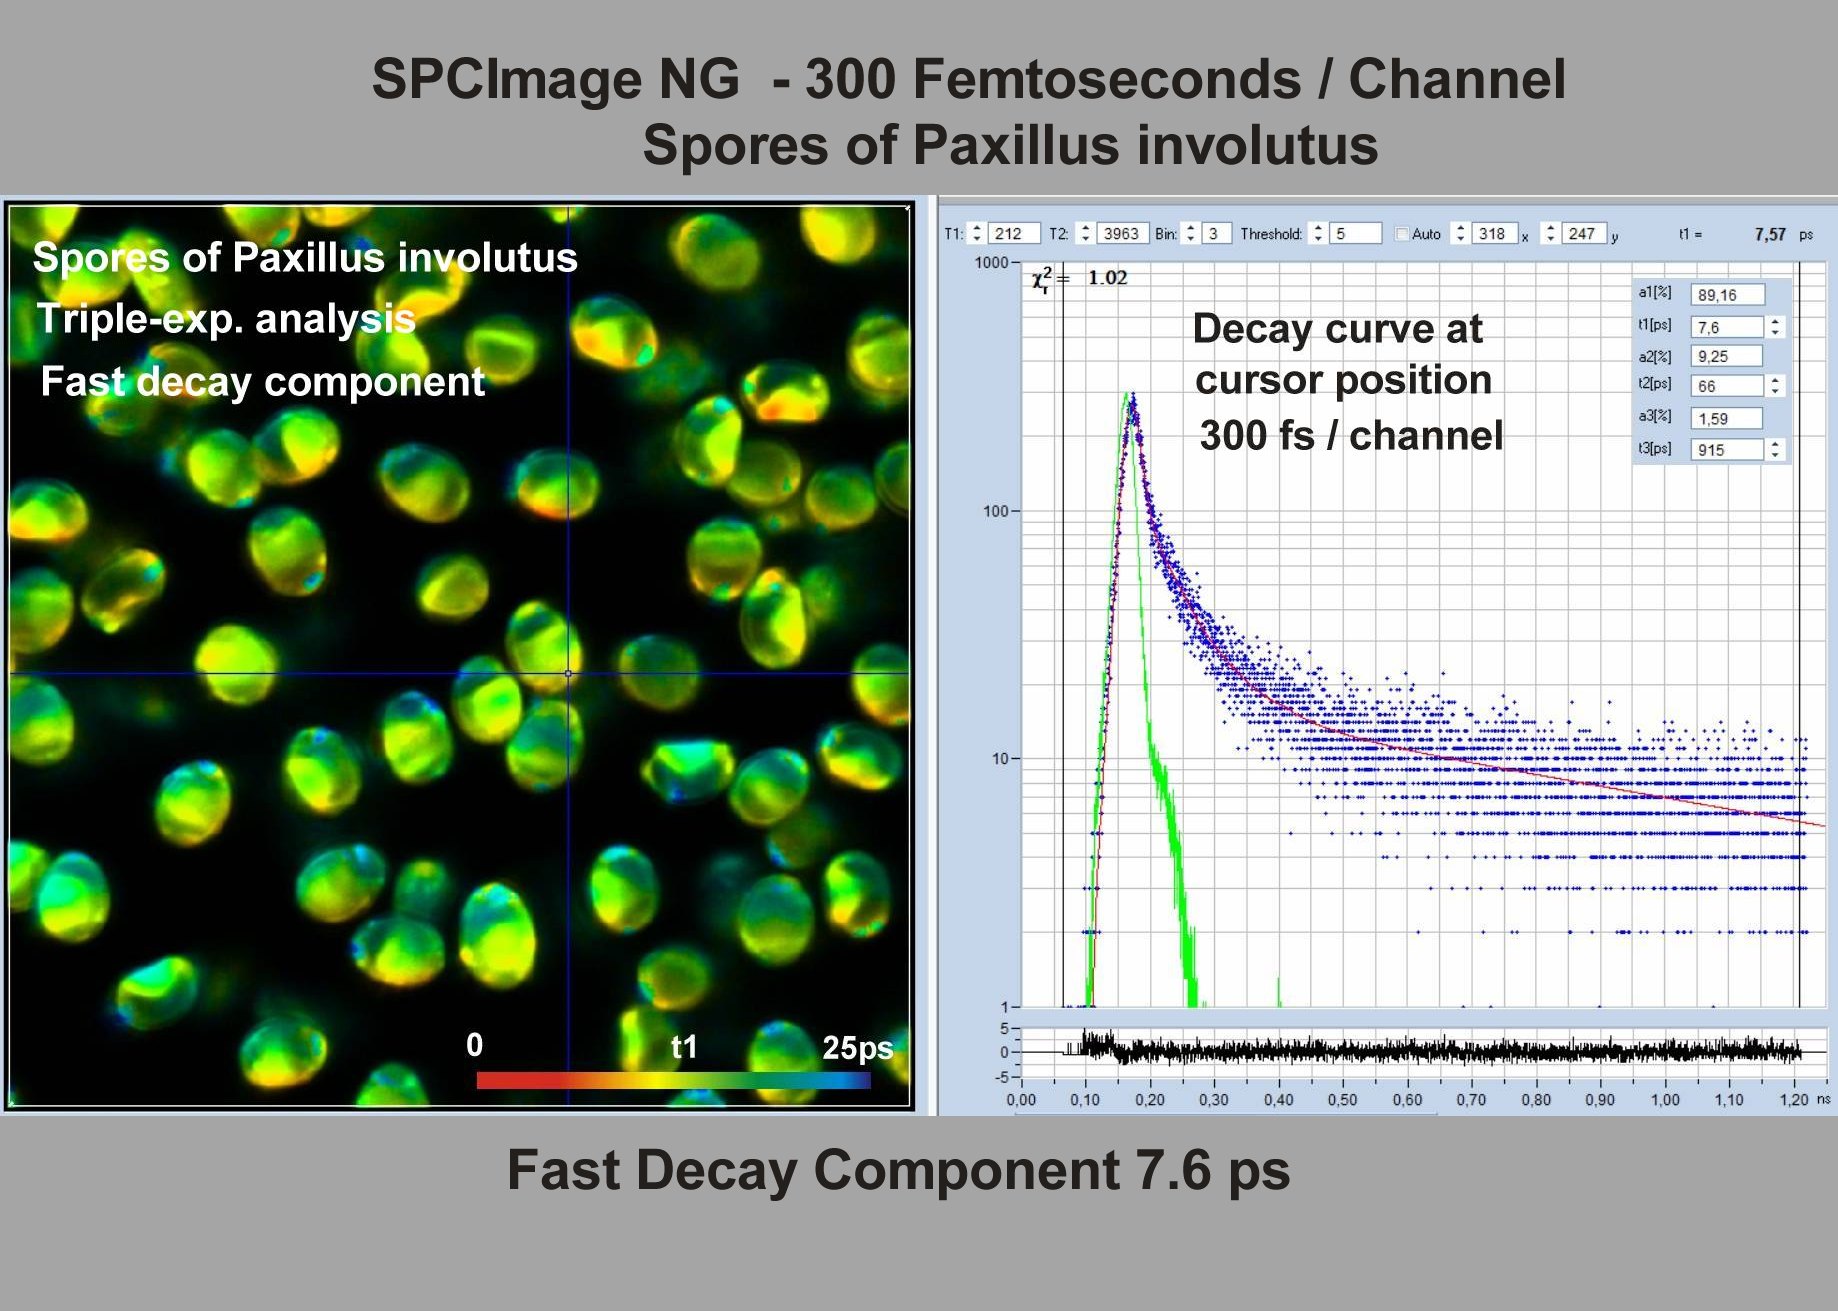
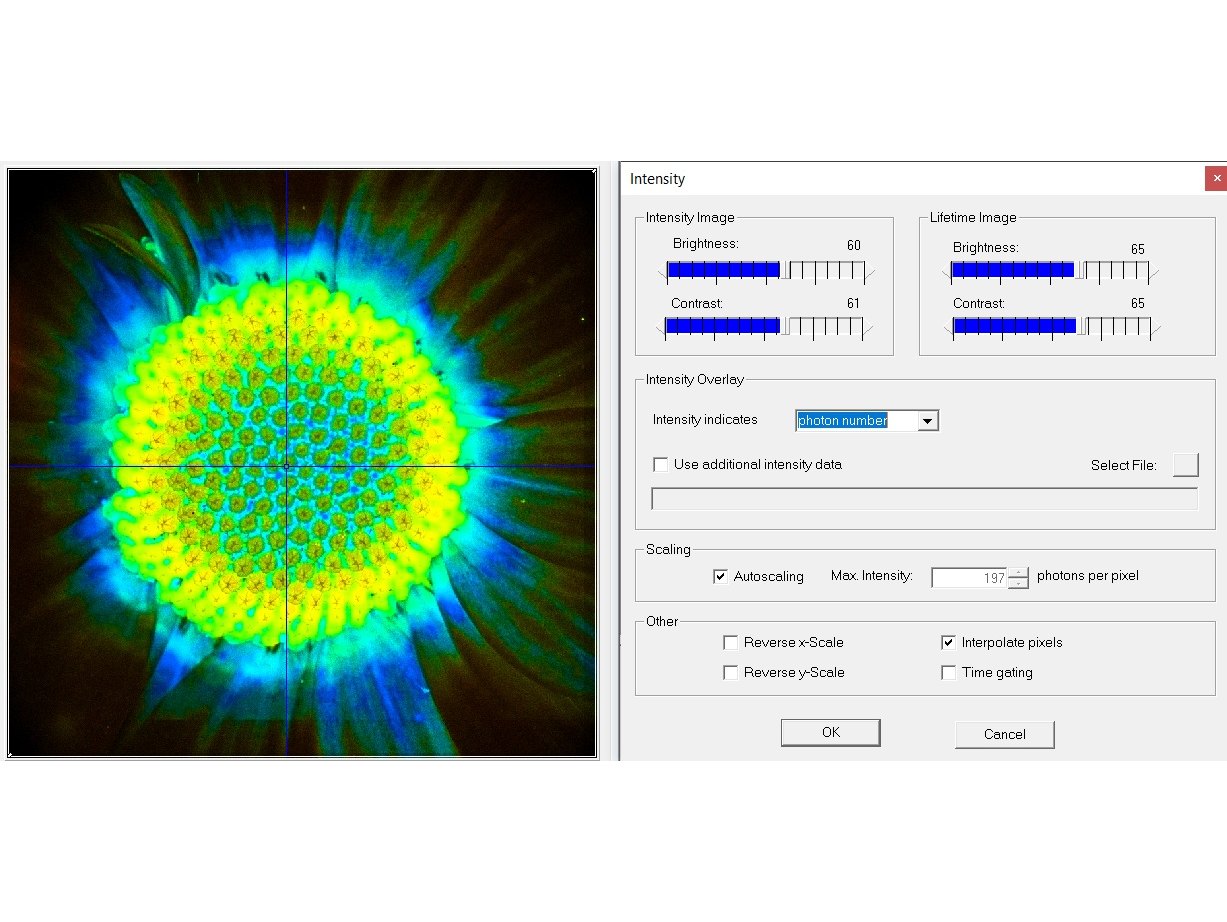
SPCImage NG uses an iterative convolution procedure. It fits the decay data by single-, double- and triple exponential decay models. An ‘incomplete-decay’ model is available to account for fluorescence left from previous excitation pulses. SPCImage NG also provides 'Maximum-Likelihood Fit' algorithm and supports GPU processing for even more precise fit results, and much faster calculation. In FLIM and PLIM data, SPCImage NG runs the fit procedure in the individual pixels of the image. The lifetime of a single-exponential decay function, amplitude or intensity-weighted lifetimes of multi-exponential decay functions, lifetime components and amplitudes of the decay components, fractional intensity contributions, or ratios of amplitudes, lifetimes and intensity contributions are displayed as colour of the image. Thus, images of local environment parameters such as pH, oxygen or ion concentrations, of the FRET efficiency, of the distance and fraction of interacting proteins, or bound and unbound fluorophores can be produced.
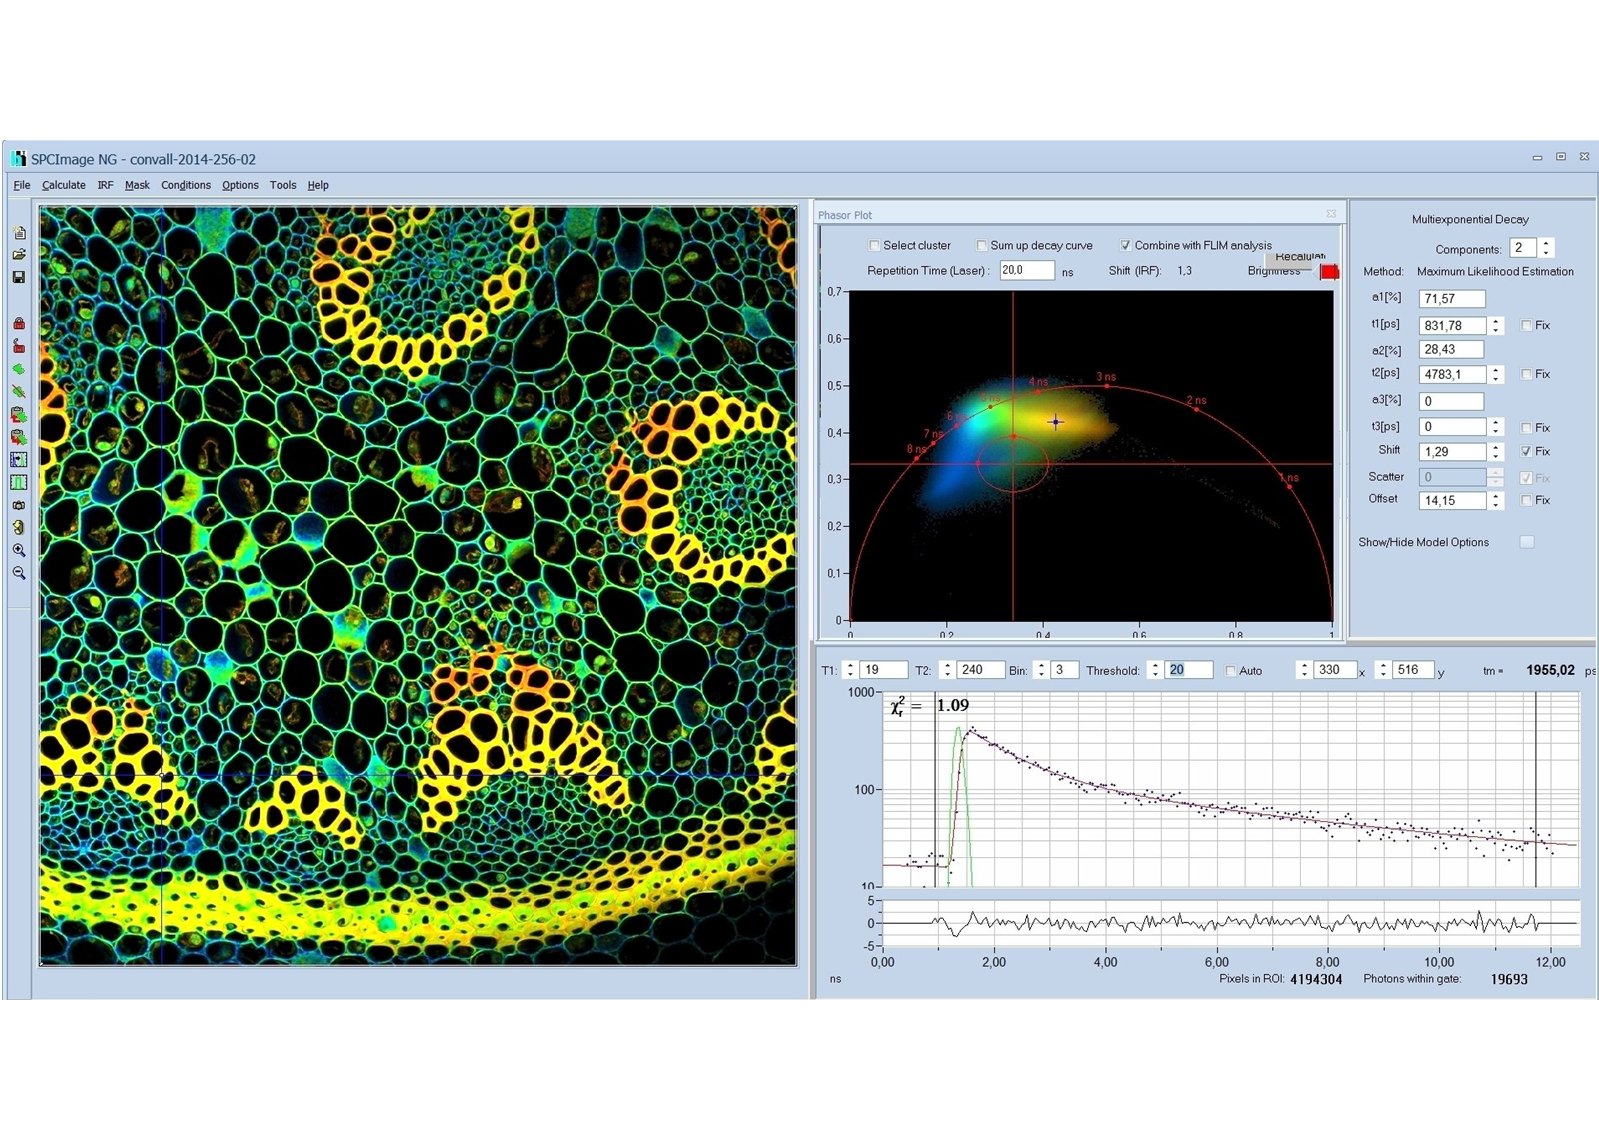
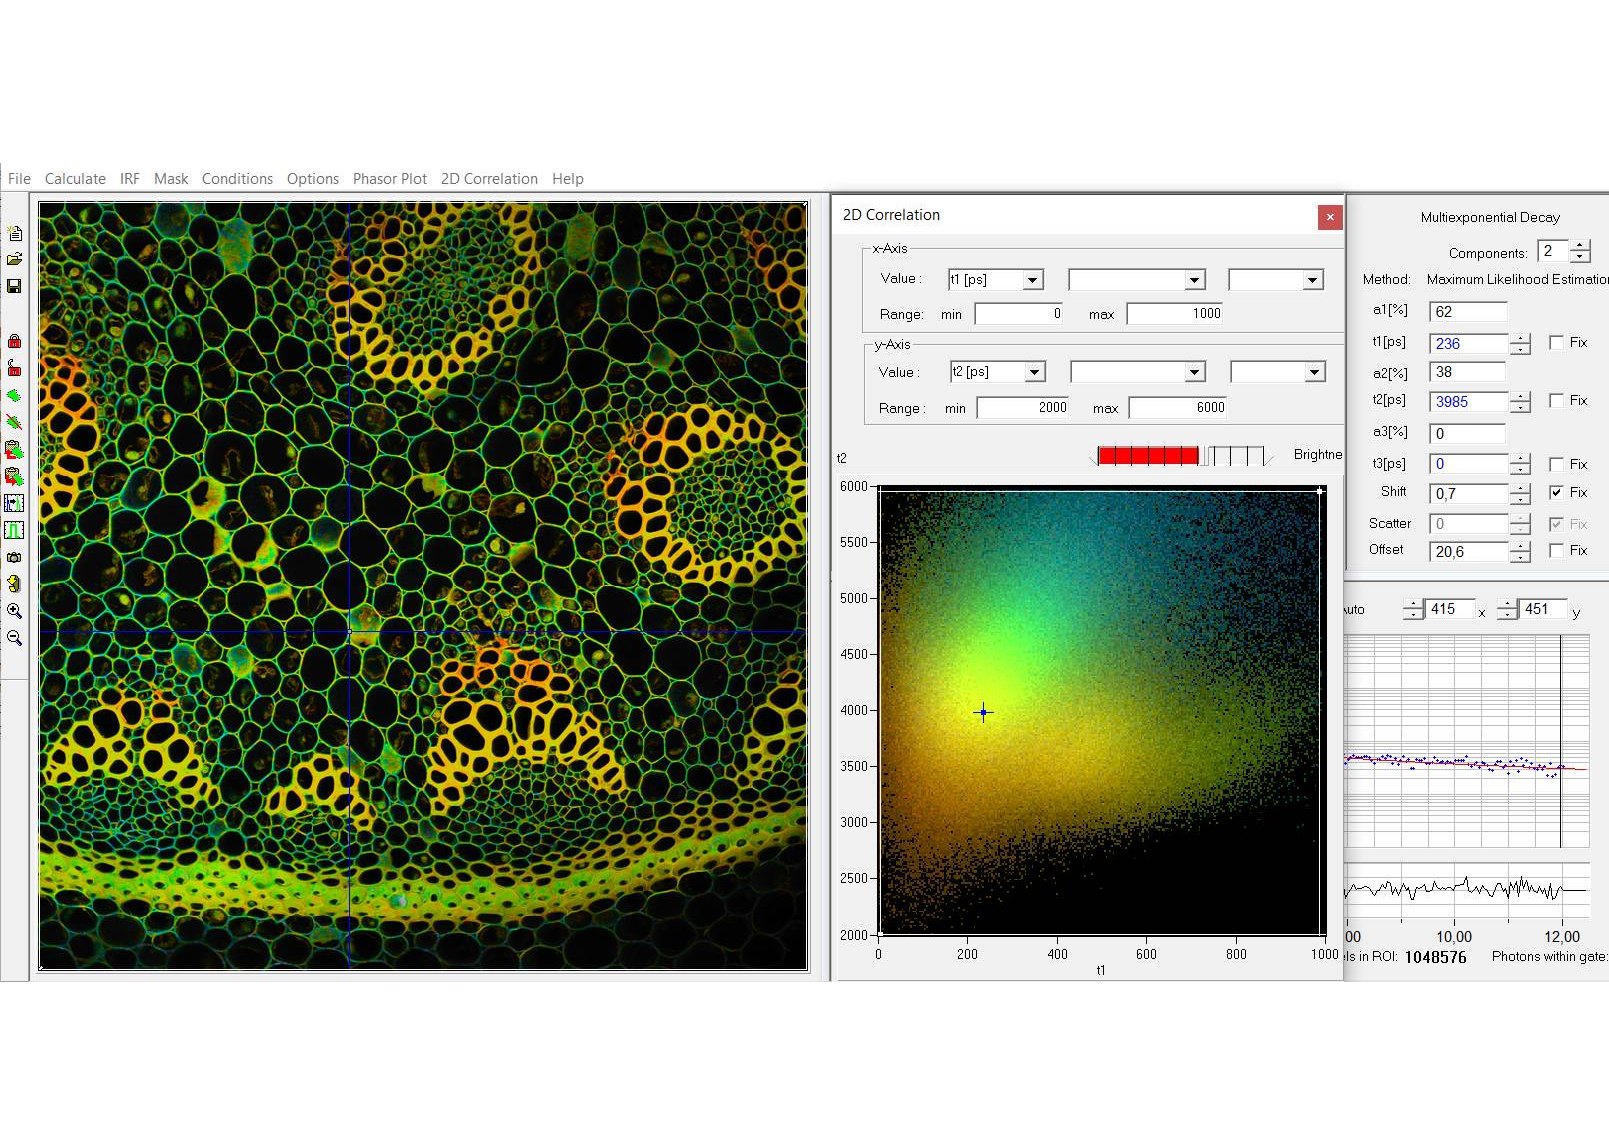
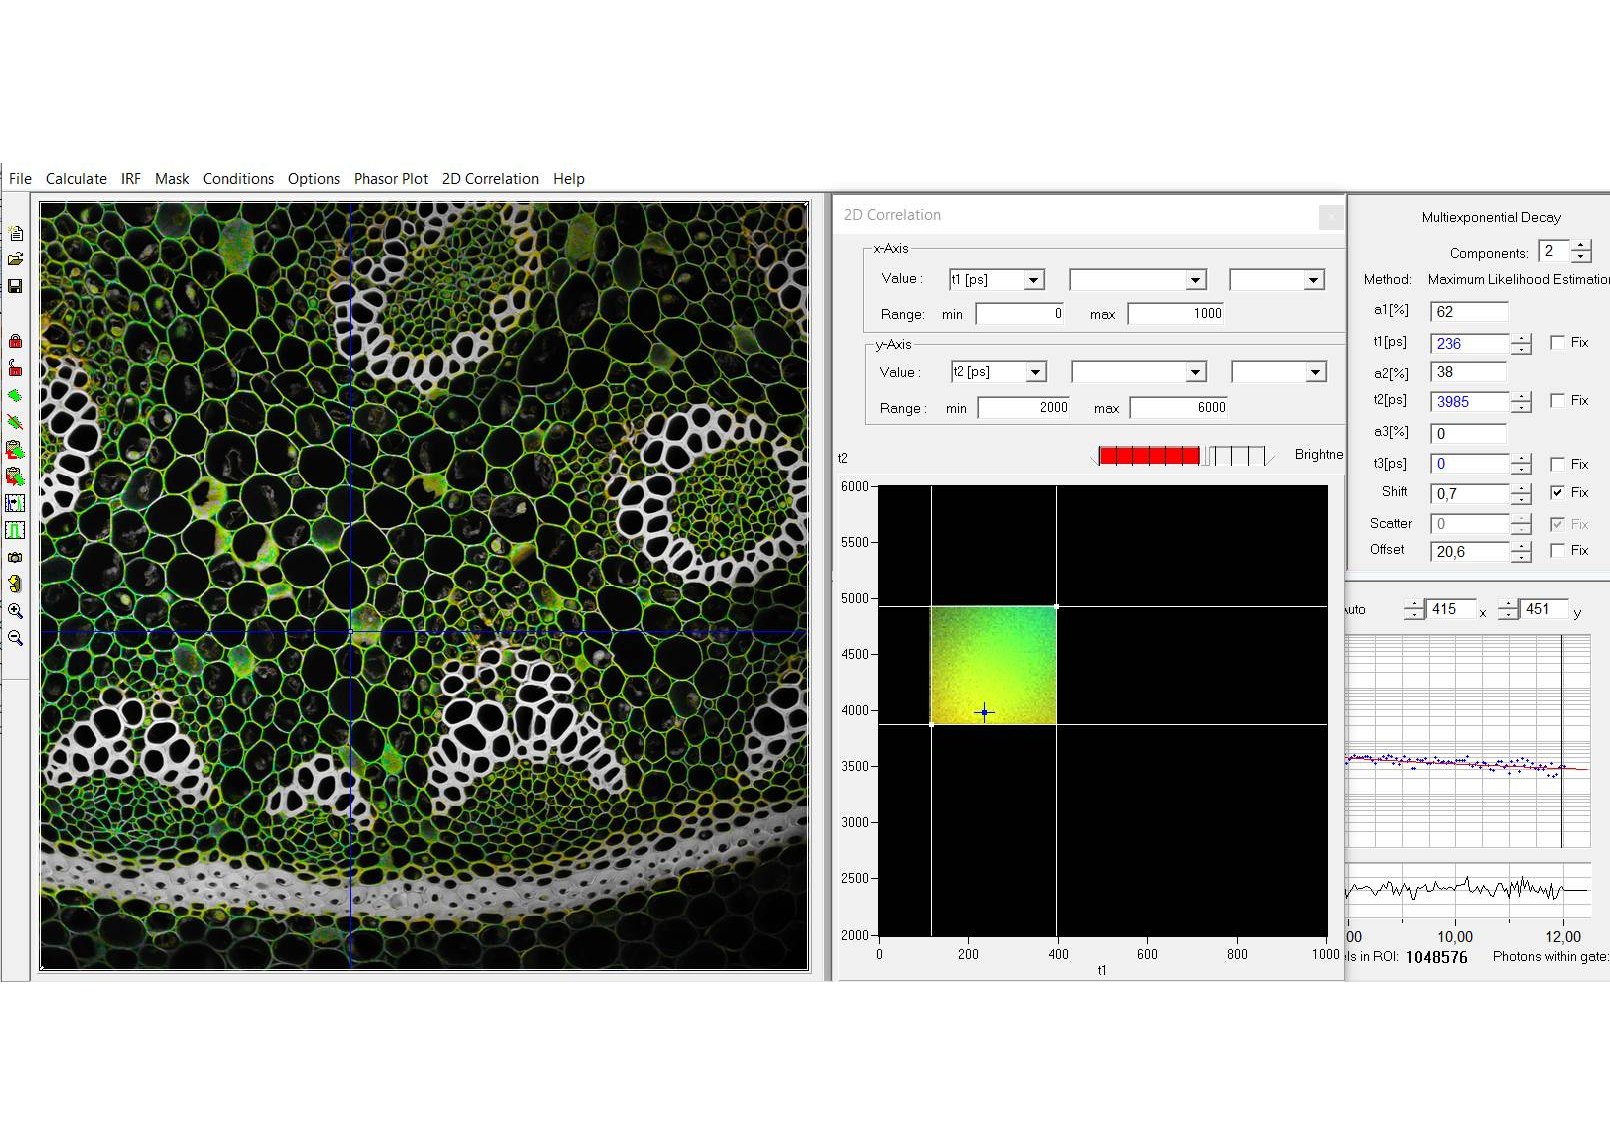
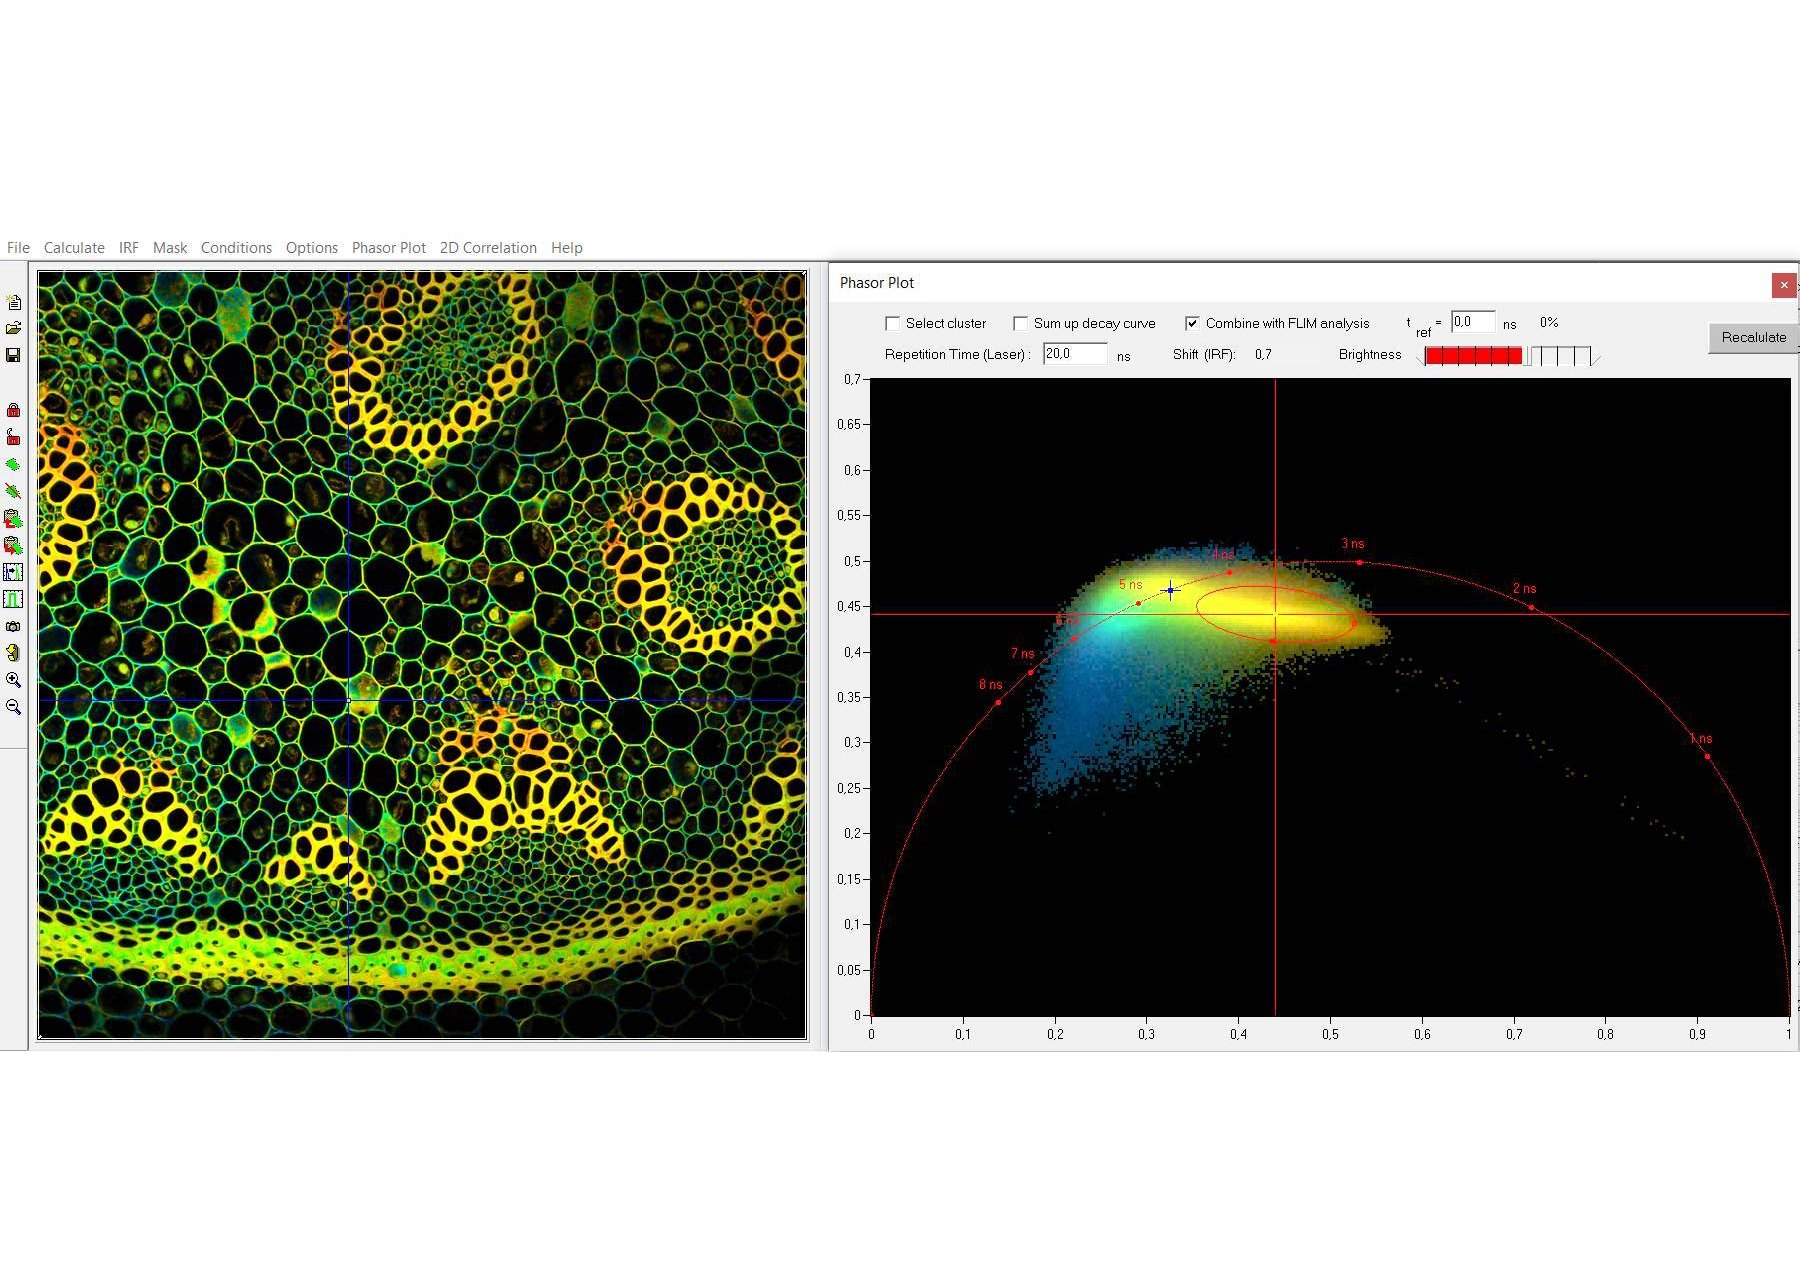
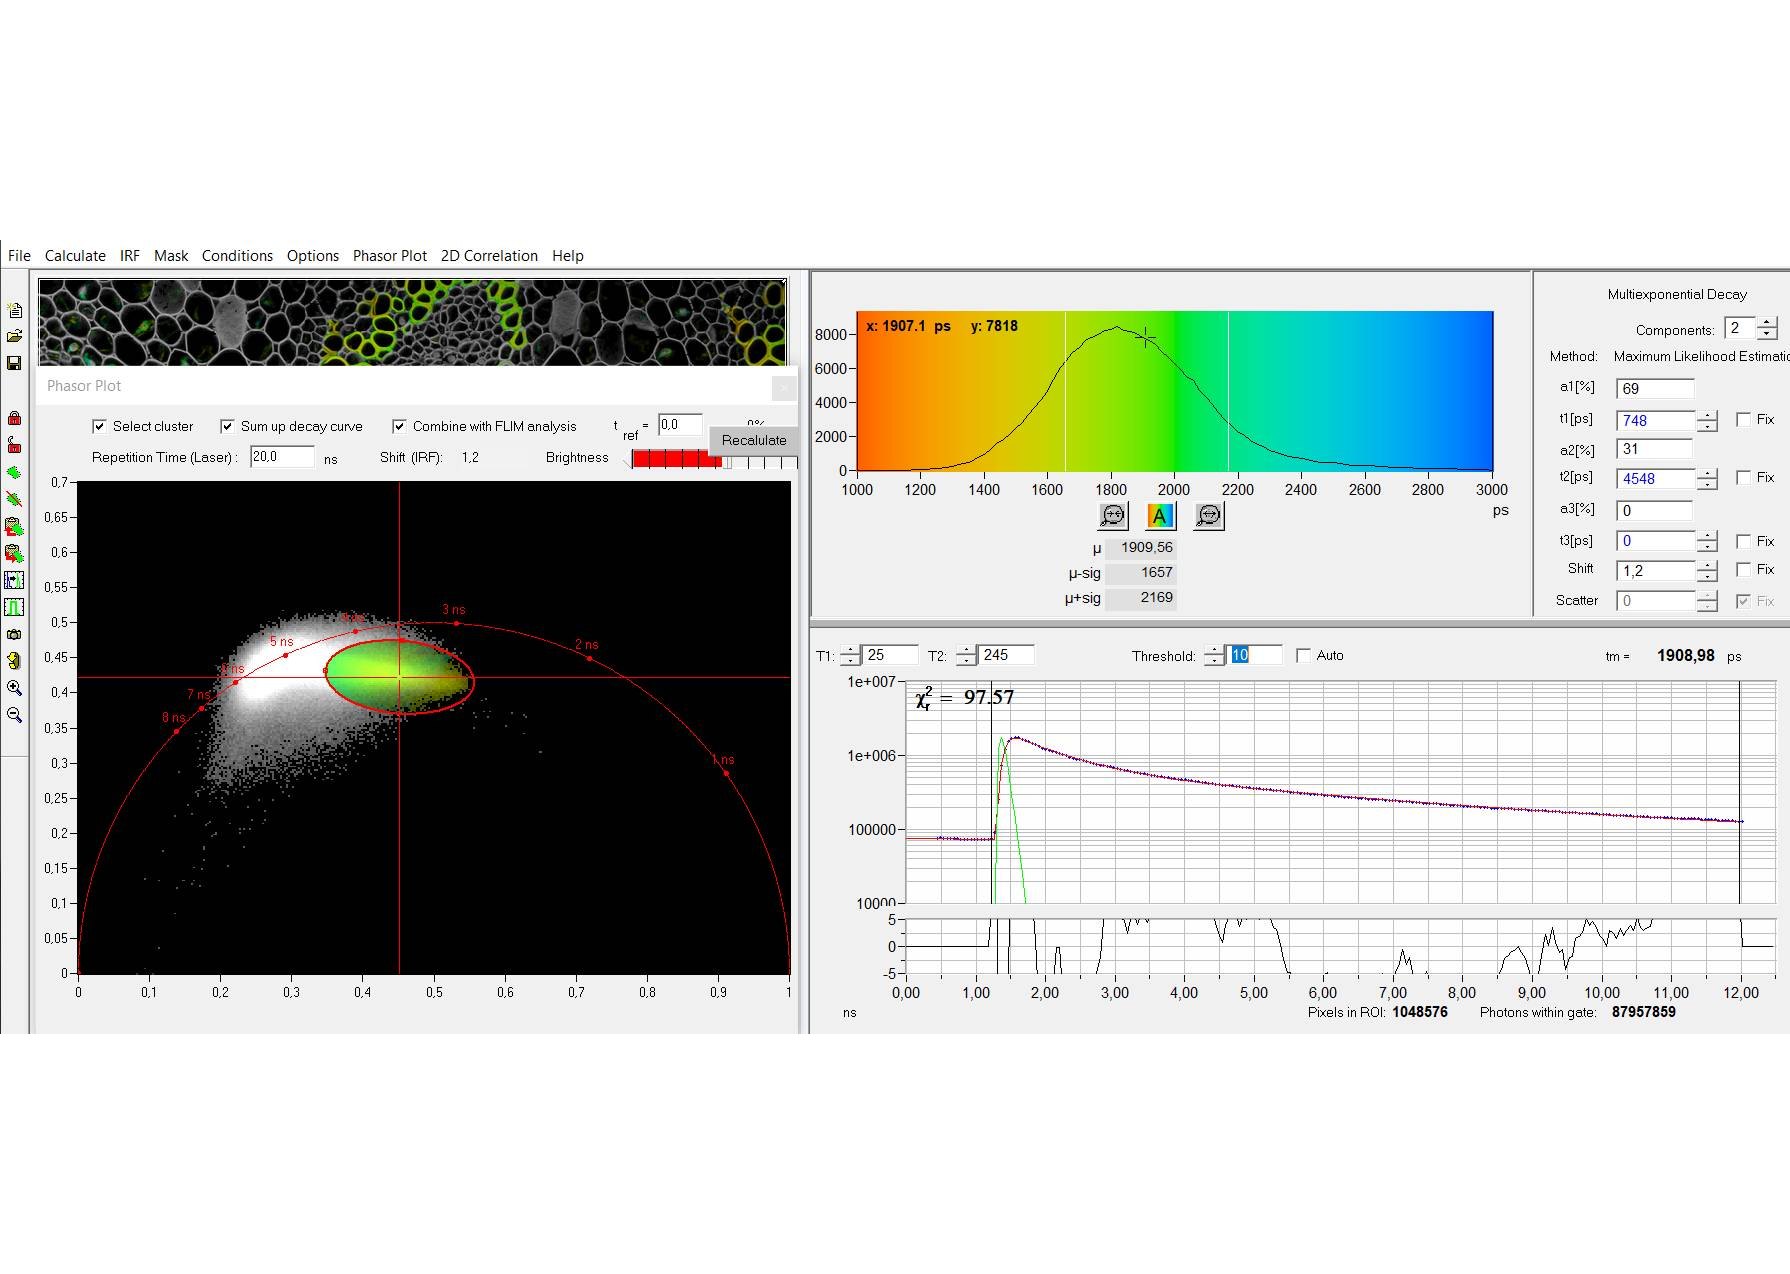
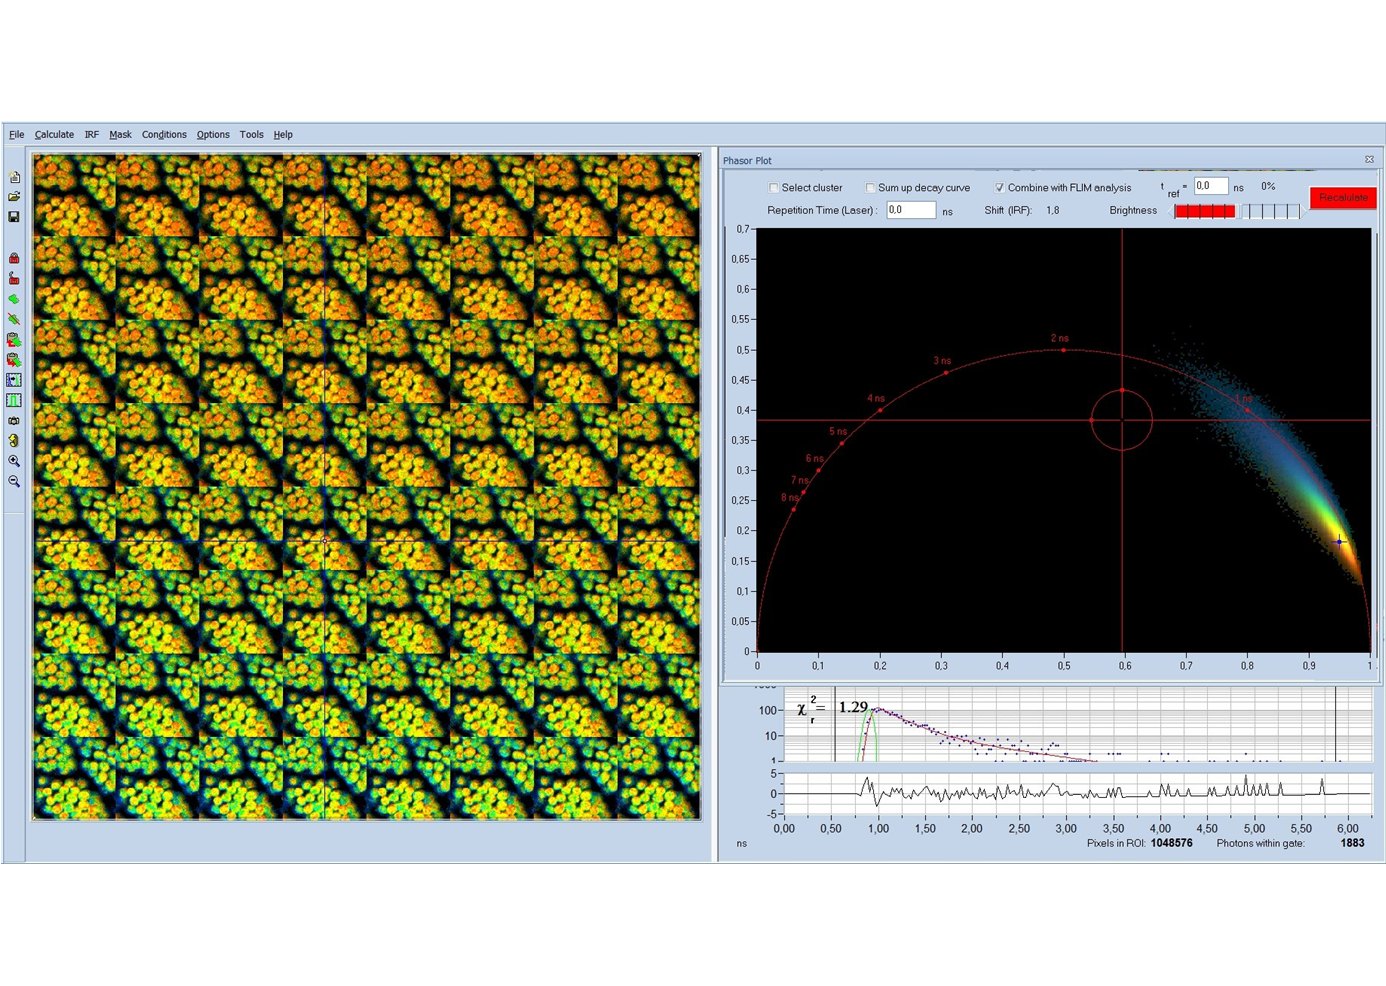
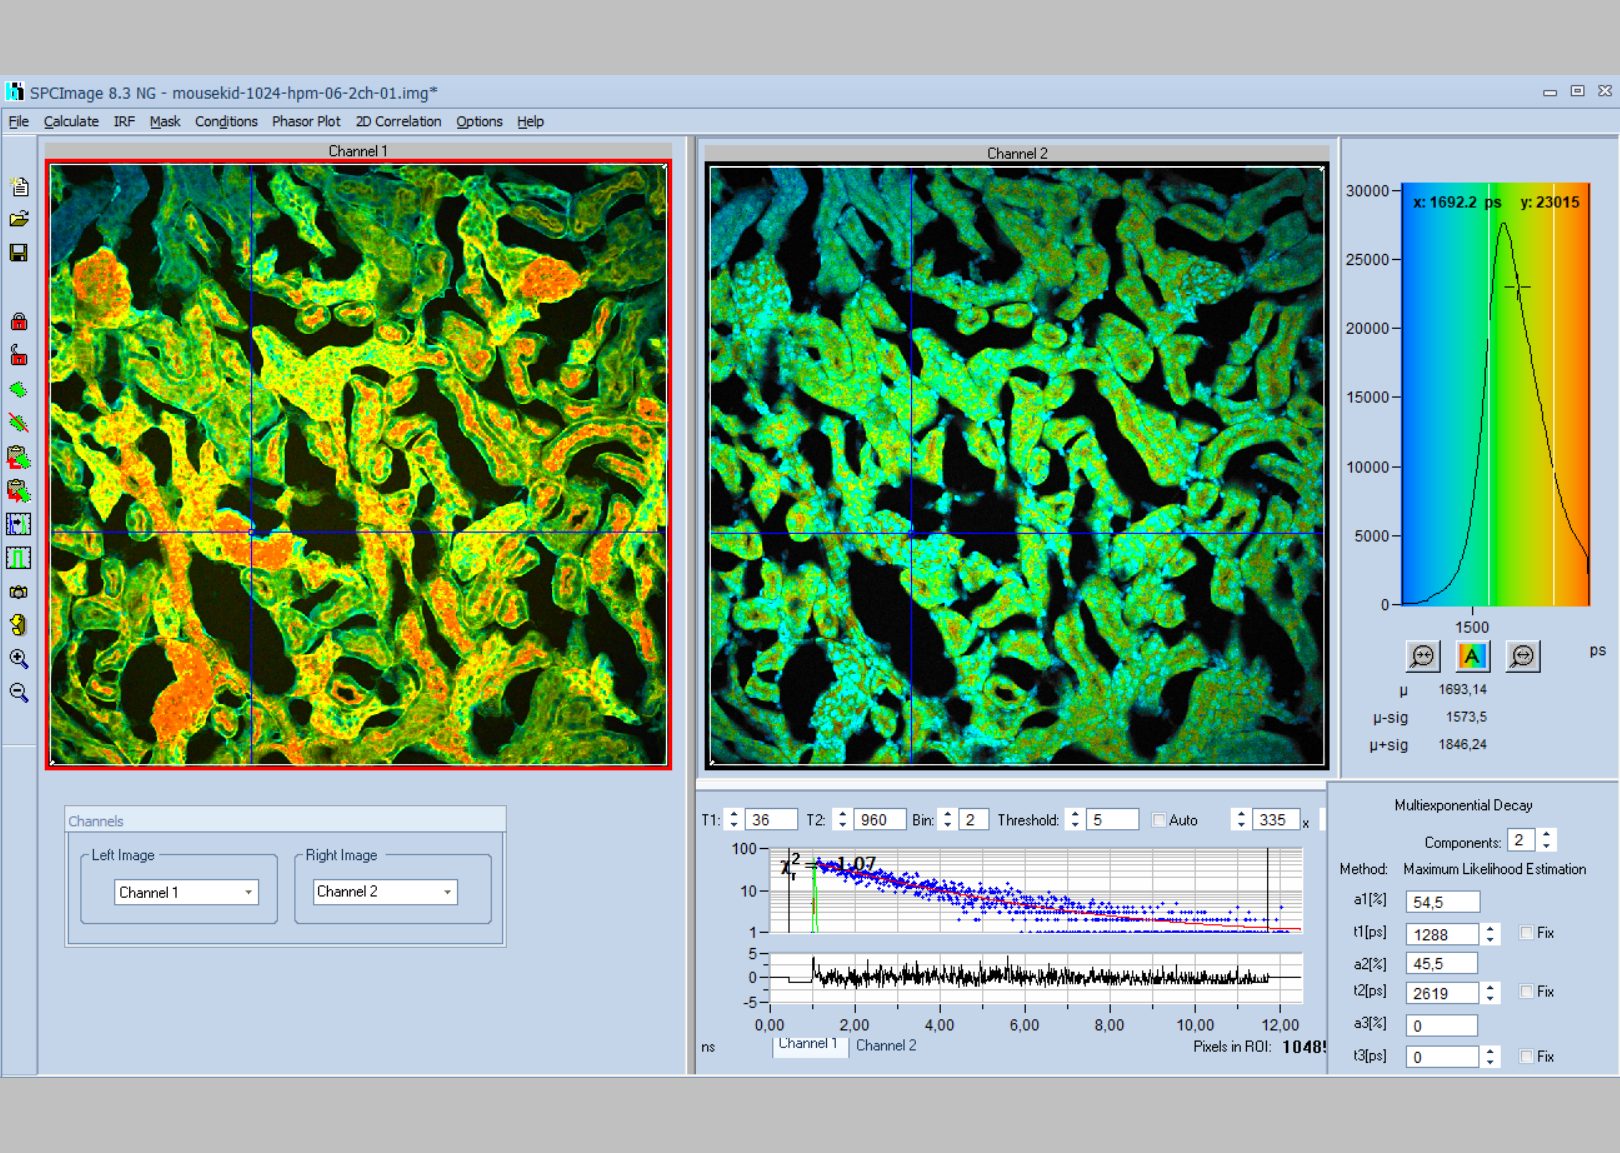
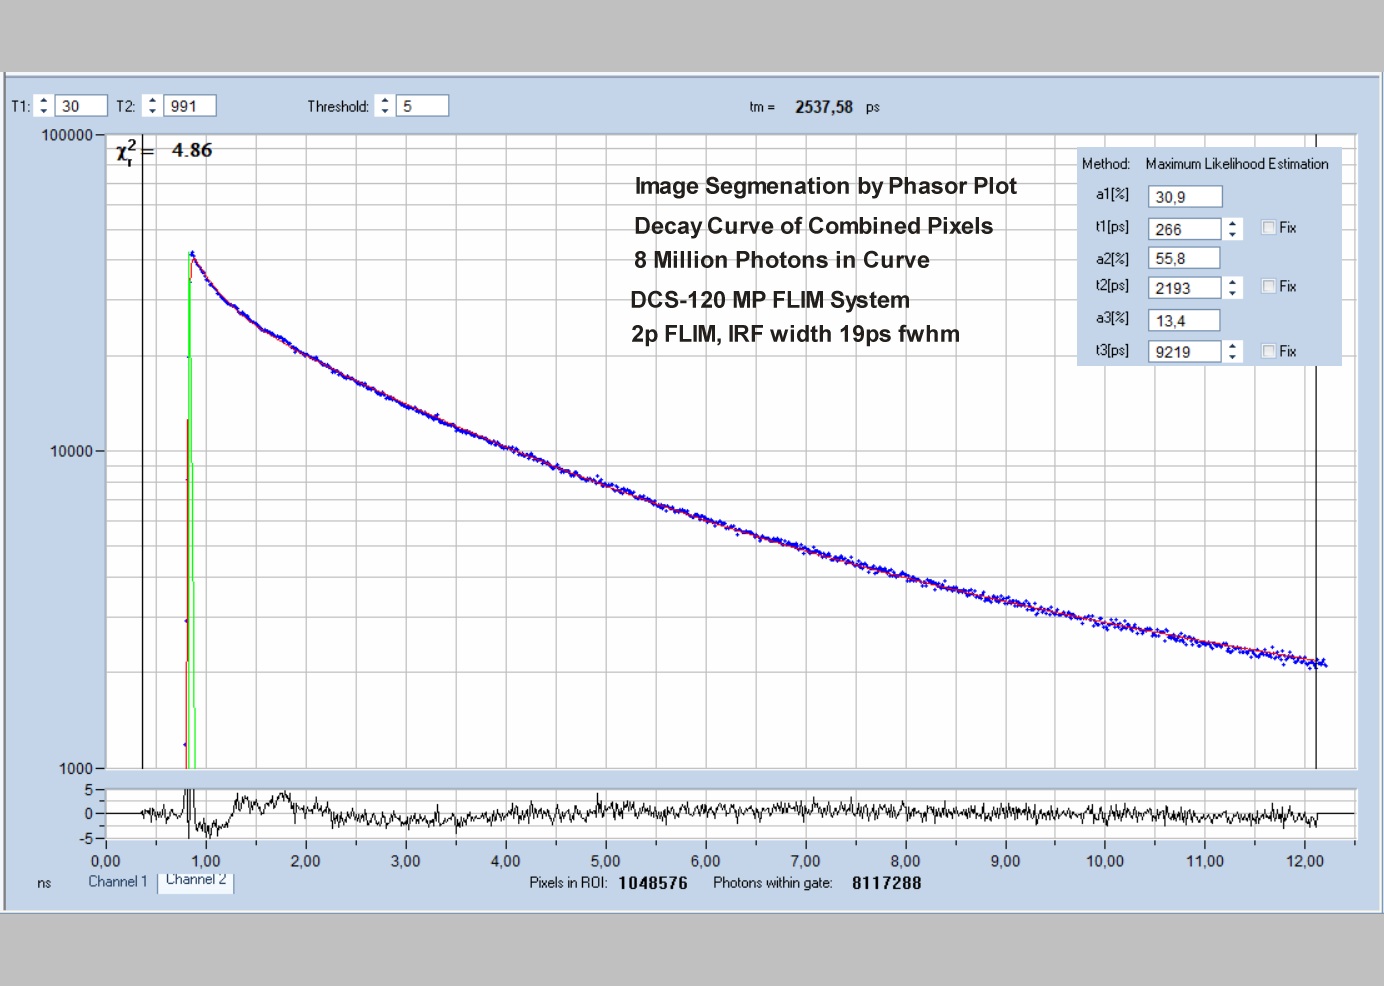
Since version 6.0 SPCImage FLIM analysis software combines time-domain multi-exponential decay analysis with the phasor plot. In the phasor plot, the decay data in the individual pixels are expressed as phase and amplitude values in a polar diagram. Independently of their location in the image, pixels with similar decay signature form clusters in the phasor plot. Different phasor clusters can be selected, and the corresponding pixels back-annotated in the time-domain FLIM images. The decay functions of the pixels within the selected phasor range can be combined into a single decay curve of high photon number. This curve can be analysed at high accuracy, revealing decay components that are not visible by normal pixel-by pixel analysis. SPCImage NG can also be used to analyse single decay curves, such as data from cuvette experiments.
Downloads
Documents
For more details please see:
- The bh TCSPC handbook, chapter SPCImage Data Analysis Software
- Handbook of DCS-120 Confocal and Multiphoton FLIM Systems, chapter SPCImage Data Analysis Software
- Handbook of FLIM Systems for Zeiss LSM 710 / 780 / 880 Family Microscopes, chapter SPCImage Data Analysis Software
Release Notes
Installation Guide
Documents
- SPCImage NG – Overview Brochure
- Bigger and Better Photons: The Road to Great FLIM Results
- DCS-120 Confocal and Multiphoton FLIM Systems – User Handbook 9th ed. 2021
- DCS-120 Confocal and Multiphoton FLIM Systems – Overview Brochure
- FLIM Systems for Zeiss Laser Scanning Microscopes – Overview Brochure
Supported Products


Technical Literature:
Please see The bh TCSPC handbook, chapter 'SPCImage NG Data Analysis Software' and SPCImage NG Overview Brochure.
Applications
- Metabolic Imaging by FLIM
- Ophthalmic FLIM (FLIO)
- TCSPC FLIM
- Multi-Wavelength FLIM
- Personalized Chemotherapy
- Multiphoton Tomography of Skin
- Simultaneous FLIM / PLIM
- Molecular Imaging by FLIM
- FRET Imaging by FLIM
- Simultaneous Metabolic Imaging and pO2 Imaging
- FLIM of Fast Physiological Effects
- STED FLIM
Application Notes
- New SPCImage Version Combines Time-Domain Analysis with Phasor Plot
- Shifted-Component Model Improves FLIO Data Analysis
- FLIO Data Acquisition and Analysis – The Road to Success
- Precision Fluorescence-Lifetime Imaging of a Moving Object
- DCS-120 FLIM System Detects FMN in Live Cells
- FLIM at a Time-Channel Width of 300 Femtoseconds
- Ultra-Fast Fluorescence Decay in Natural Carotenoids
- Ultra-Fast Fluorescence Decay in Malignant Melanoma
- Metabolic FLIM of Macroscopic Objects
- Label-Free Multiphoton FLIM of Moving Bacteria
- Megapixel FLIM with bh TCSPC Modules – The New SPCM 64-bit Software
- Recording the Instrument Response Function of a Multiphoton FLIM System
- Suppression of Lens Fluorescence in FLIO Images of Cataract Patients
- Double-Exponential FLIM-FRET Approach is Free of Calibration
- High Resolution Z-Stack FLIM with the Becker & Hickl DCS-120 Confocal FLIM System
- Metabolic FLIM with Simultaneous pH Imaging
Gallery


- Deconvolution of Single-Curve, FLIM, PLIM, FLITS, Multi-Wavelength FLIM and Mosaic FLIM Data
- Pseudo-Global Analysis FLIM Analysis
- Batch Processing
- Single-, Double- and Triple Exponential Models
- Incomplete-Decay Model
- Shifted-Component Model
- First-Moment Analysis
- Automatic IRF or Measured IRF
- Binning, Overlapping Rectangular or Circular
- Display of Single- and Multi-Exponential Decay Data
- Amplitude- or Intensity-Weighted Lifetimes
- Lifetimes and Amplitudes of Components
- Intensity Contributions of Components
- Quotients of Lifetimes or Amplitudes
- FRET Efficiencies
- Fluorescence Lifetime Redox ratio (FLIRR)
- ROI Definition
- One- or Two-Dimensional Parameter Histogramms
- Phasor Plot, Combined with Time-Domain Analysis
- Image Segmentation by Phasor Plot
- Parameter Histogramms of Segmented Areas
- Combination of Pixels Selected by Phasor Plot
- Precision Time-Domain Analysis of Combined Pixel Data