Version 6.0 SPCImage FLIM analysis software combines time-domain decay analysis with the phasor plot. In the phasor plot, the decay data in the individual pixels are expressed as phase and amplitude values in a polar diagram. Independently of their location in the image, pixels with similar decay signature form clusters in the phasor plot.
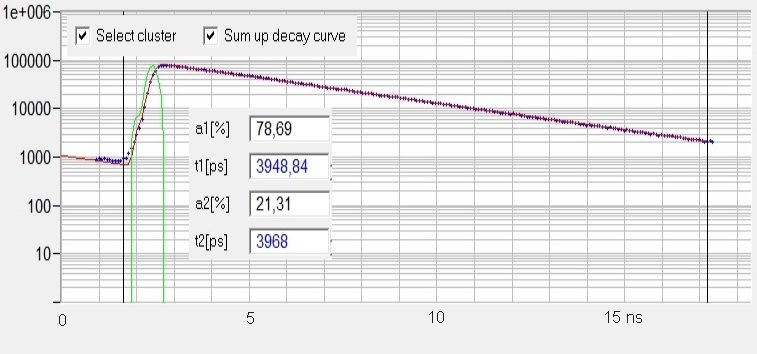
Different clusters can be selected in the phasor plot, and the corresponding pixels back-annotated in the time-domain FLIM images. The decay functions of the pixels within the selected phasor range can be combined into a single decay curve of high photon number. This curve can be analysed at an accuracy comparable to that of single-point decay measurements in cuvettes. Low-amplitude decay components or decay components with almost similar lifetimes can thus be identified in the data. Examples for differently selected phasor ranges of the data shown above are given in figures below.
For details please see application note ‘New SPCImage Version Combines Time-Domain Analysis with Phasor Plot’.
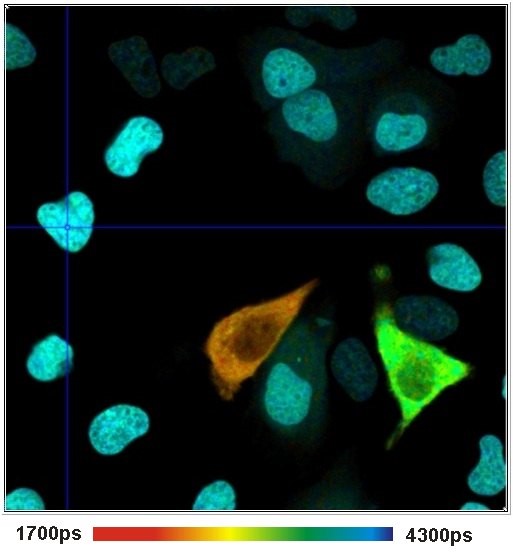
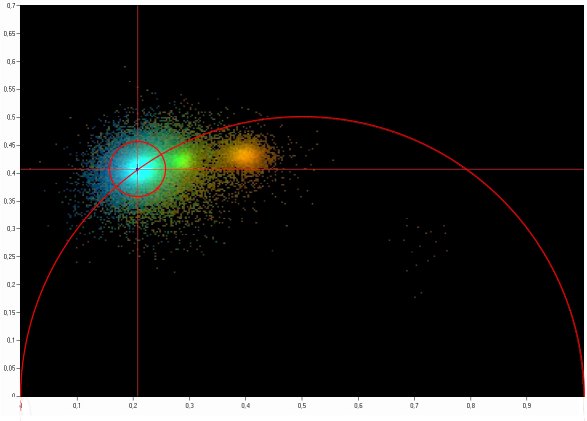
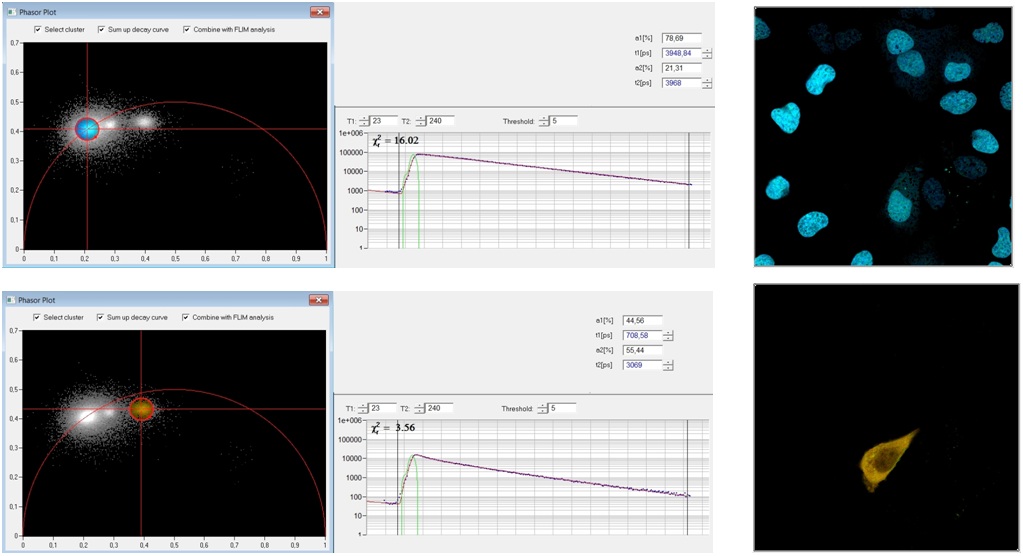
Left: Lifetime image and lifetime histogram. Middle Left: Phasor plot. The clusters in the phasor plot represent pixels of different lifetime in the lifetime image. Recorded by bh Simple-Tau 152 FLIM system with Zeiss LSM 880. Right: Selecting a cluster of phasors in the phasor plot (left). Combination of the decay data of the corresponding pixels in a single decay curve (middle). Display of the pixels corresponding to the selected cluster in the phasor plot (right). Top to Bottom: Selection of different phasor clusters selects cells with different decay signature.
