A Common
Mistake in Lifetime-Based FRET Measurement
Wolfgang Becker,
Axel Bergmann, Becker & Hickl GmbH
Abstract: FRET efficiencies derived from FLIM FRET
experiments are obtained from the ratio of the fluorescence lifetimes of the
FRET donor in presence and in absence of the acceptor. It is implicitly assumed
that when the FRET intensity changes the donor lifetime linearly follows the
donor intensity. It is therefore expected that the FLIM-based FRET efficiency
reflects the FRET efficiency obtained in intensity-based FRET experiments. We
show that this is wrong. A part of the donor does not participate in the FRET,
and the donor fluorescence decay profile becomes double exponential. A
single-exponential approximation of the donor lifetime does not represent the donor
intensity, and the FLIM-FRET efficiency no longer reflects the Intensity-FRET efficiency.
Correct FRET efficiencies are only obtained by double-exponential decay
analysis and using the amplitude-weighted average of the donor-component
lifetimes for calculating the FRET efficiency. We further show that useful FRET
efficiencies can be calculated from the lifetime of the decay component of the
interacting donor. These interacting-donor FRET efficiencies are free of the
influence of the non-interacting donor fraction. Interacting-donor FRET efficiencies
can be converted directly into donor-acceptor distances.
Förster resonance energy transfer (FRET) is an interaction of two fluorophore molecules (or, more
exactly a fluorophore and an absorber) that are located in close distance to
each other. If the emission band of one fluorophore overlaps the absorption
band of the other energy from the first dye, the donor, is transferred to the
second one, the acceptor [17, 18], see Fig. 1, left. Because of its dependence
on the donor-acceptor distance FRET measurements have become an important tool
of cell biology [22, 23, 24, 25]. The efficiency of the energy transfer, or the
'FRET efficiency', has originally been defined as
 (1)
(1)
where IDA is the donor
intensity in presence of an acceptor, ID the donor intensity
in absence of an acceptor.
Intensity-based FRET measurements are
difficult because intensities depend on the concentration of the fluorophore,
the excitation power, and the sensitivity of the detection system. Therefore
calibration measurements from cells containing only the donor and the acceptor are
required [19]. These make the
technique difficult to use and susceptible to systematic errors.
Calibration problems can be avoided by
lifetime-based FRET measurement [1, 2]. When FRET occurs the donor is loosing
part of its energy to the acceptor, with the effect that its fluorescence
lifetime becomes shorter, see Fig. 1, right.
Fig. 1: Förster-resonance energy transfer. The lifetime of the donor
becomes shorter when it interacts with an acceptor.
The lifetime-based FRET efficiency is:
 (2)
(2)
tDA is the donor lifetime in presence
of acceptor, tD is the donor lifetime in absence
of acceptor.
The lifetime-based FRET efficiency (2) can
be derived from the intensity-based one under the presumption that the donor
intensity and the donor lifetime are proportional to each other.
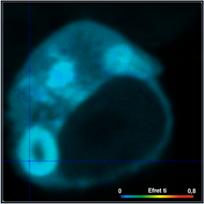
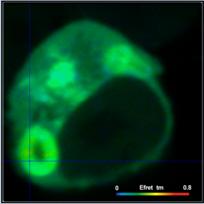
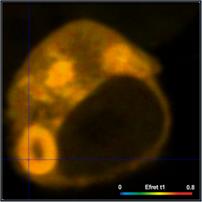
An example for a FRET measurement is shown
in Fig. 2. The cell expresses two interacting proteins, one linked to the
donor, CFP, the other to the acceptor, YFP. FRET occurs in locations where the
proteins interact. A lifetime image is shown on the left, an image of the FRET efficiency
on the right.
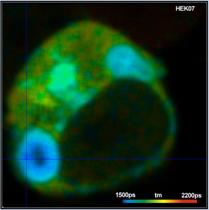
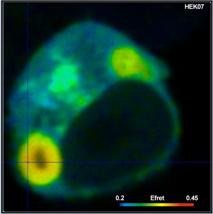
Fig. 2: HEK cell expressing two
interacting proteins, one labelled with the donor, CFP, the other with the
acceptor, YFP. Donor image. Left: Lifetime image. Right: Image of the FRET efficiency.
The FLIM-FRET technique outlined above is
easy to use and robust. It has been used for many years and for a wide variety
of protein interaction studies, see for example [13, 14, 15, 16, 25]. For an
overview on the FLIM FRET literature please see [1].
Despite the amazing success of FLIM FRET the
technique has a hidden problem: The definition of the FLIM FRET efficiency implicitly
assumes that the donor decay is single-exponential. In real FRET system this is
not the case, see decay curves in Fig. 3.
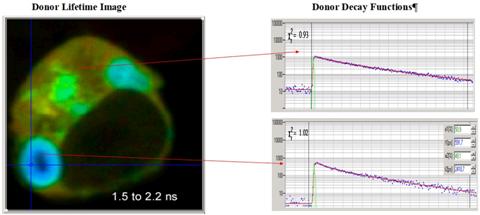
Fig. 3: HEK
cell, expressing two interacting proteins, labelled with CFP (donor) and YFP
(acceptor). Note the multi-exponential profile of the decay curves.
The multi-exponential decay of the FRET
donor has been ignored for many years. Now, there is little doubt that it comes
from the presence of a non-interacting donor fraction. The resulting donor
decay functions can be approximated by a double-exponential model, with a fast
component from the interacting donor fraction and a slow lifetime component
from the non-interacting donor fraction [1, 2, 11, 12]. The double-exponential nature of
the interacting-donor decay has consequences to the definition of the FRET efficiency.
FLIM FRET Efficiency from Double-Exponential Donor Decay
A double-exponential decay is described by two lifetimes, t1 and t2, and two amplitude coefficients, a1
and a2:
f(t)
= a1 e-t/t1 + a2 e-t/t2
Fig.
4: Amplitudes and intensities of the components of a double-exponential decay
However, the definition of the FLIM-FRET efficiency
uses only one lifetime, tDA, to describe the decay time of the
interacting donor. So, what is the 'Lifetime' of a double-exponential decay?
The problem is normally solved by using a single-exponential
approximation of the double-exponential decay. In other words, tDA is replaced with a weighted average of the component lifetimes, t1 and t2. There are two different definitions
for this average. The most common one is the 'Intensity-Weighted Lifetime', or ti. It weighs the lifetimes of the decay components by their
intensities, i.e. the areas under the components. These are a1t1 for the fast component and a2t2 for the slow component.
The second definition
weighs the component lifetimes by their amplitudes, a1 and a2.
The result is the 'Amplitude-Weighted Lifetime'. It is usually called 'Mean Lifetime',
tm. The mathematical expressions of ti and tm are:
Intensity-Weighted
Lifetime Amplitude-Weighted Lifetime
 with
with

Which lifetime is the correct one to
calculate the FRET efficiency? The definition of the FLIM-based FRET efficiency
leaves it open. The answer can be found by taking a close look at the equations
above.
The definition of the FLIM-FRET intensity
(2) derives from the definition of the intensity-FRET intensity (1). Therefore,
the terms in the definitions of ti and ti should be in some reasonable relationship with the intensity of the
donor. There is no such relationship for the products a1t12 and a2t22 in the definition of ti . Therefore, using ti for tDA in (2) does not make sense. Its use for calculating the FRET
efficiency leads to wrong results.
The situation is different for tm. The products a1t1 and a2t2 in the definition of tm are
the areas under the decay components, i.e. intensities. The sum
of both represents the intensity of the donor. Therefore, tm has to be used for tDA to
obtain an equivalent of the intensity-based FRET efficiency (1). That means the FLIM FRET efficiency is

The fact that the amplitude-weighted
lifetime must be used to calculate Efret has implications on FLIM
systems for FRET measurements in general. tm is only obtained by recording well resolved decay functions and
splitting them into exponential components by double-exponential decay analysis.
A FLIM system or a FLIM technique which does not build up detailed decay
functions in the individual pixels is not able to deliver tm. This is especially the case
for many 'Fast FLIM' techniques which produce only 'Lifetimes' instead of decay
functions [21]. These lifetimes are equivalent to the intensity-weighted lifetime
and are thus not suitable to determine FRET efficiencies. The same is the case
for a number of 'Rapid Lifetime Analysis' techniques. These are usually based
on ratios of gated intensities or moments of the measured decay signals. Also
these lifetimes are intensity-weighted and unsuitable for the measurement of
FRET efficiencies.
That the FRET efficiency has to be
calculated from the amplitude-weighted lifetime has already been pointed out by
J.R.L. Lakowicz in his 1999 edition of 'Principles of Fluorescence
Spectroscopy'. Until now, this has not been commonly noticed, although the book
and its 2006 successor [20] is constantly cited in fluorescence papers.
Double-Exponential Decay Analysis
As explained above, correct determination
of the FRET efficiency requires double-exponential decay analysis.
Multi-exponential analysis of FLIM data is often considered difficult of even
impossible. However, the efficiency of decay analysis depends dramatically on
the composition of the decay profiles. For typical donor decay data with tDA/ tD ratios larger than four the options
are not as bad as commonly believed. Moreover, in the last decade, the
capabilities of multi-exponential FLIM recording and data analysis have
increased considerably. More sensitive detectors have increased the number of
photons in the FLIM data [9],
the time resolution of detectors and TCSPC systems has increased [6, 7, 8], Maximum-Likelihood
Estimation (MLE) and intelligent binning have reduced the number of photons per
pixel needed for double-exponential FLIM analysis [3], and GPU processing has reduced the data
processing time [3]. With these improvements, FLIM data analysis is not only able
to deliver the amplitude-weighted lifetime, tm, but also the lifetimes, t1 and t2, and the amplitudes, a1
and a2, of the two decay components. The meaning of these
parameters is illustrated in Fig. 5.
Fig. 5: Donor
fluorescence decay components in a FRET system
The availability of these parameters makes
it possible to calculate the FLIM FRET Efficiency:
Efret = 1- tm/tD or Efret = 1-
(a1t1 + a2 t2) / tD
Moreover, the slow decay component of the donor
decay, t2, is identical with the donor
lifetime in absence of the acceptor, tD. Efret
then becomes
Efret = 1- tm/t2 or Efret = 1-
(a1t1 + a2 t2) / t2
This equation contains only parameters that
are determined by analysis of the measured donor decay. That means
double-exponential FRET analysis works without external calibration [5].
Interacting-Donor FRET Efficiency
Another frequent mistake in FRET
calculations is to use the classic intensity FRET or FLIM FRET efficiency to
calculate donor-acceptor distances. It has been shown above that the donor
decay function is the sum of a decay component from interacting donor and a
decay component from non-interacting donor. Even if the correct lifetime, tm, is used Efret does not represent the real FRET
efficiency of the interacting-donor fraction. Also this problem can be solved
by double-exponential FRET analysis.
The pure interacting-donor FRET efficiency
is obtained by using the lifetime, t1, of
the interacting donor fraction in the equation of the FRET efficiency:
Einteract = 1- t1 /tD
Again, tD is identical with the lifetime of the non-interacting
donor, t2, i.e.:
Einteract = 1- t1 /t2
Einteract can be directly converted into the donor-acceptor distance, r, relative to the Förster
radius, r0:
( r / r0
) = 1 / Einteract - 1 or, more
directly: ( r / r0 ) = t1
/ (t2 -
t1), with
r0 = Förster
radius
FRET analysis based on these considerations
is described in [3, 4, 5].
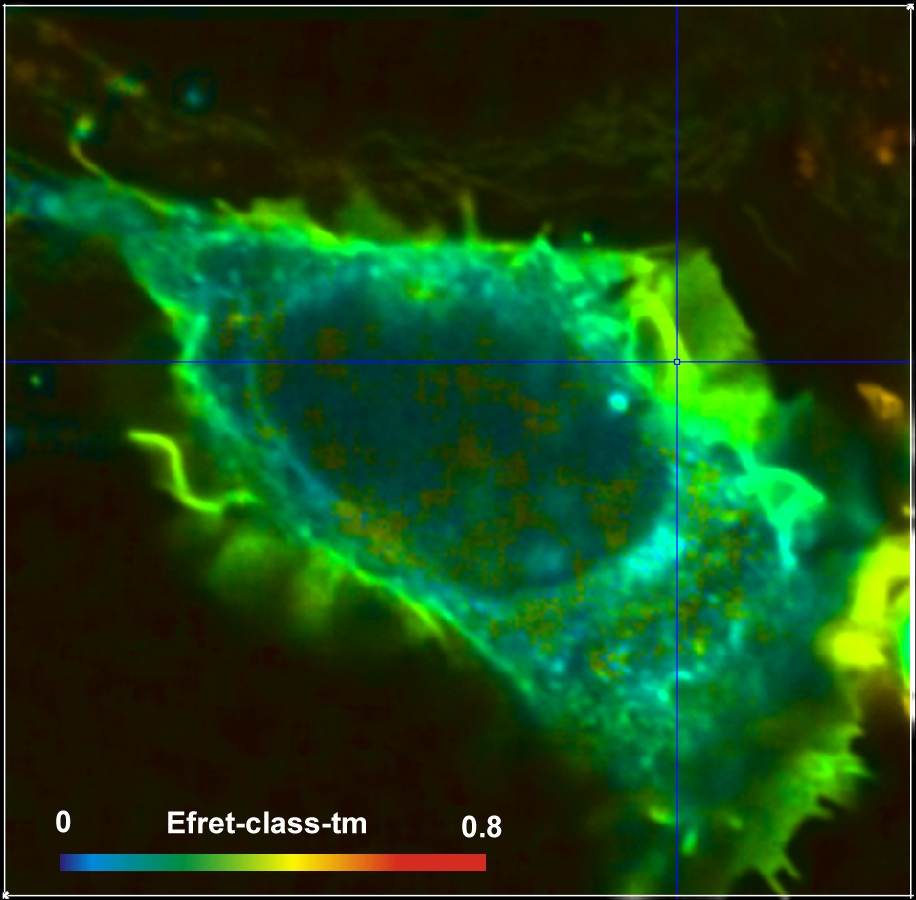
Comparison of Different Definitions of the FRET efficiency
FRET efficiencies based on different
definitions for two different cells are compared in Fig. 6. Left to right, the
images show the FRET efficiency calculated from the intensity-weighted lifetime,
ti, the amplitude-weighted lifetime, tm, and from the interacting-donor lifetime, t1. Colour scaling is the same for all images. Average FRET efficiencies
are shown above the images.
Efret-ti
= 0.18 Efret-tm = 0.35 Einteract
= 0.72
Efret-ti
= 0.24 Efret-tm =
0.4 Einteract = 0.65
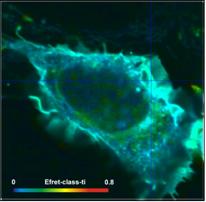
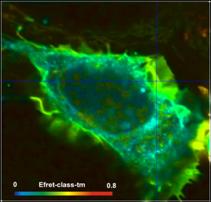
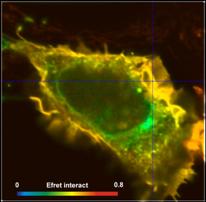
Fig. 6: FRET efficiencies
based on different definitions are compared for two different cells. Left to
right: FRET efficiency calculated from the intensity-weighted lifetime, ti, the
amplitude-weighted lifetime, tm, and from the interacting-donor lifetime, tfret.
All images were calculated by bh SPCImage
NG FLIM analysis software. Maximum-Likelihood Estimation (MLE) in combination
with a double-exponential incomplete-decay model was used to fit the donor
decay data. The images of the FRET efficiencies were calculated by SPCImage
parameter calculation functions [3].
As can be seen from Fig. 6, the differences
between the different FRET efficiency definitions are substantial. The
difference between the ti and the tm efficiencies are almost 1:2. This is hardly tolerable for
characterising protein interaction in cells. FRET efficiencies calculated from
intensity-weighted lifetimes or from single-exponential approximations should therefore
not be used in FRET experiments.
Of course, there are also differences
between the tm-based efficiencies and the t1-based efficiencies (Einteract). However, this is not
surprising. The differences are explained by the fact that a substantial
fraction of the donor molecules does not participate in the FRET and,
consequently, biases the tm FRET efficiency towards lower values.
Whether the tm efficiency or the tfret efficiency is to be used depends on the application. tm-based efficiencies should be used for comparing FLIM FRET results
with intensity-FRET results, tfret-based efficiencies (Einteract)
for comparing donor-acceptor distances.
FRET Analysis by SPCImage NG
It is unlikely that you will obtain or have
obtained wrong FRET efficiencies with bh FLIM systems and bh SPCImage data
analysis. From the earliest versions on, the default lifetime for
multi-exponential decay was the amplitude-weighted lifetime tm. We did this as a courtesy to FRET users. Moreover, the SPCImage
data calculation and data display functions contain the tm‑based classic FRET efficiency, Eclass, and the interacting-donor
FRET efficiency, Eint. Both are calculated correctly. The only
mistake you can possibly do is to run a single-exponential fit or a first-moment
analysis on the FLIM-FRET data. However, in this case SPCImage would deliver
improbable Eclass and Eint values so that the mistake
would be noticed.
Summary
FRET efficiencies derived from FLIM FRET
experiments are traditionally obtained from the ratio of the fluorescence
lifetimes of the FRET donor in presence of the acceptor and in absence of the
acceptor. The definition is derived from the intensity-based definition of the
FRET intensity, which uses the ratio of the corresponding intensities. It is implicitly
assumed that the donor lifetime in presence of the acceptor linearly follows the
(normalised) intensity. It is therefore expected that the FLIM-based FRET efficiency
reflects the intensity-based FRET efficiency. These assumptions are correct when
the donor decay is single-exponential. This is, however, not the case. One part
of the donor fluorescence comes from non-interacting donor molecules, another
part from interacting ones. The resulting fluorescence decay is
double-exponential. The classic definition does not take this into account. It
contains only one lifetime for the 'donor in presence of an acceptor'. The
problem is usually solved by using an average - or 'apparent' - lifetime of the
donor decay. The usual approach is to use an intensity-weighted average, ti, of the lifetimes of the two components. The intensity-weighted
average is used because ti is identical with the lifetime of a
single-exponential approximation or the 'apparent' lifetime of the donor decay.
Unfortunately, the intensity-weighted
lifetime does not linearly represent the donor intensity, and the FLIM-FRET efficiency
based on it is not identical with the Intensity-FRET efficiency. To obtain
correct FLIM-FRET efficiencies, the amplitude-weighted average of the donor component
lifetimes, tm, must be used. The amplitude
weighted lifetime can only be obtained by recording well resolved donor decay
functions, analysing them with a double-exponential decay model, and
calculating the amplitude-weighted lifetime from the decay parameters.
A third FLIM-FRET efficiency can be
obtained by using of the decay component of the interacting donor for tDA. The resulting FRET efficiency is, of course, different from the
intensity-based FRET efficiency. However, it represents the FRET efficiency
exclusively for the interacting donor molecules, without the influence of the
non-interacting donor fraction. The interacting-donor FRET efficiency is therefore
higher than the Intensity-FRET or the FLIM-FRET efficiency. Its advantage is
that it can be converted directly into donor-acceptor distances.
References
1.
W. Becker, The bh TCSPC Handbook. 9th ed. Becker
& Hickl GmbH (2021)
2.
W. Becker, Advanced time-correlated single-photon counting techniques. Springer,
Berlin, Heidelberg, New York, 2005
3.
SPCImage Data Analysis, in W. Becker, The bh
TCSPC Handbook. 9th ed. Becker & Hickl GmbH (2021)
4.
W. Becker, Molecular imaging by TCSPC FLIM -
Application to metabolic imaging and FRET imaging. One-day symposium on
advanced microscopy techniques in the biomedical sciences, Charlottesville,
2023
5.
W. Becker, Axel Bergmann, Double-exponential
FLIM-FRET is free of calibration. Application note, www.becker-hickl.com (2023)
6.
W. Becker, C. Junghans, V. Shcheslavskiy, High-Resolution
Multiphoton FLIM Reveals Ultra-Fast Fluorescence Decay in Human Hair.
Application note, www.becker-hickl.com (2023)
7.
W. Becker, A. Bergmann, C. Junghans, Ultra-Fast
Fluorescence Decay in Natural Carotenoids. Application note, www.
becker-hickl.com (2022)
8.
Becker & Hickl GmbH, Sub-20ps IRF Width from
Hybrid Detectors and MCP-PMTs. Application note, www.becker-hickl.com (2017)
9.
W. Becker, B. Su, K. Weisshart, O. Holub, FLIM
and FCS Detection in Laser-Scanning Microscopes: Increased efficiency by GaAsP
Hybrid Detectors. Micr. Res. Tech. 74, 804-811 (2011)
10.
W. Becker, The bh TCSPC Handbook. 1st ed. Becker
& Hickl GmbH (2005)
11.
W. Becker, A. Bergmann, M.A. Hink, K. König, K.
Benndorf, C. Biskup, Fluorescence lifetime imaging by time-correlated single
photon counting, Micr. Res. Techn. 63, 58-66
(2004)
12.
W. Becker, K. Benndorf, A. Bergmann, C. Biskup,
K. König, U. Tirlapur, T. Zimmer, FRET measurements by TCSPC laser scanning
microscopy, Proc. SPIE 4431, 94-98 (2001)
13.
B. J. Bacskai, J. Skoch, G.A. Hickey, R. Allen,
B.T. Hyman, Fluorescence resonance energy transfer determinations using
multiphoton fluorescence lifetime imaging microscopy to characterize
amyloid-beta plaques, J. Biomed. Opt 8, 368-375 (2003)
14.
R. Cao, H. Wallrabe, K. Siller, S. R. Alam, A.
Periasamy, Single cell redox states analyzed by fluorescence lifetime metrics
and tryptophan FRET interaction with NAD(P)H. Cytometry Part A, 96A, 110-121
(2019)
15.
Y. Chen, A. Periasamy, Characterization of
two-photon excitation fluorescence lifetime imaging microscopy for protein
localization, Microsc. Res. Tech. 63, 72-80
(2004)
16.
R.R. Duncan, A. Bergmann, M.A. Cousin, D.K.
Apps, M.J. Shipston, Multi-dimensional time-correlated single-photon counting
(TCSPC) fluorescence lifetime imaging microscopy (FLIM) to detect FRET in
cells, J. Microsc. 215, 1-12 (2004)
17.
Th. Förster, Zwischenmolekulare Energiewanderung und Fluoreszenz, Ann. Phys.
(Serie 6) 2, 55-75 (1948)
18.
Th. Förster, Energy migration and fluorescence.
Translated by Klaus Suhling. J. Biomed. Opt. 17 011002-1 to -10 (2012)
19.
G.W. Gordon, G. Berry, X.H. Liang, B. Levine, B.
Herman, Quantitative Fluorescence Resonance Energy Transfer Measurements Using
Fluorescence Microscopy. Biophys. J. 74, 2702-2713 (1998)
20.
J.R. Lakowicz, Principles of Fluorescence
Spectroscopy, 3rd edn., Springer (2006)
21.
X. Liu, D. Lin, W. Becker, J. Niu, B. Yu, L.
Liu, J. Qu, Fast fluorescence lifetime imaging techniques: A review on
challenge and development. Journal of Innovative Optical Health Sciences,
1930003-1 to -27 (2019)
22.
A. Periasamy, Methods in Cellular Imaging.
Oxford University Press, Oxford New York (2001)
23.
A. Periasamy, R.M. Clegg, eds., FLIM Microscopy
in Biology and Medicine. CRC Press 2009
24.
A. Periasamy, N. Mazumder, Y. Sun, K. G.
Christopher, R. N. Day, FRET Microscopy: Basics,
Issues and Advantages of FLIM-FRET Imaging. In: W. Becker (ed.) Advanced
time-correlated single photon counting applications. Springer, Berlin,
Heidelberg, New York (2015)
25.
Y. Sun, C. Rombola, V. Jyothikumar, A.
Periasamy, Förster resonance energy transfer microscopy and spectroscopy to
localize protein-protein interactions in live cells. Cytometry A, 83A(9),
780-793 (2013)
Contact:
Wolfgang Becker
Becker & Hickl GmbH
Berlin, Germany
Email: becker@becker-hickl.com