bh TCSPC Systems Record FLIM with Sutter MOM
Microscopes
Wolfgang
Becker, Becker & Hickl GmbH
Abstract: The Sutter Instrument MOM microscope [6] is
a modular platform for imaging deep within live samples. It uses multi-photon excitation
by a titanium-sapphire laser in combination with non-descanned detection. Due
to its pulsed excitation source and its high modularity the MOM system can easily
be combined with the bh TCSPC FLIM systems. Up to four FLIM detectors can be
attached to the system. The signals are processed in up to four entirely
parallel TCSPC FLIM channels. Due to the parallel system architecture, high
photon count rates and short acquisition times can be achieved. FLIM data can
be recorded with up to 1024x1024 pixels and 1024 time channels.
System Architecture
The general system architecture of the
Sutter / bh FLIM system is shown in Fig. 1. The MOM microscope is based on the
usual multiphoton configuration. A femtosecond Ti:Sa laser is used as an
excitation source. The laser beam is reflected down to the microscope lens by a
fast galvanometer scanner. A scan lens projects the axis of the scan mirrors
into the principle plane of the objective lens. The angular motion of the scan
mirrors is thus converted into a lateral motion of the laser focus in the
sample. The fluorescence light emitted by the sample is collected and
collimated by the microscope lens. A dichroic mirror separates the fluorescence
light from the laser light and projects it towards the detectors. A beam
splitter assembly splits the fluorescence light into several spectral
components, and projects them on the detectors. The optical setup takes
advantage of the fact that multiphoton excitation is confined to a thin layer
around the focal plane of the microscope lens. Therefore the fluorescence light
needs not be sent back through the scanner and through a confocal pinhole.
Instead, photons leaving the back aperture of the microscope lens are projected
directly on the detectors. Even scattered photons from image planes deep inside
the sample are thus detected and used to build up the images. Please see [2] or
[3] for details.
Fig. 1:
General principle of the bh/Sutter FLIM systems
Up to four FLIM detectors can be placed at
the beamsplitter assembly of the MOM microscope, and the signals be processed
in parallel FLIM channels. A front view of the MOM system with two FLIM
detectors attached is shown in Fig. 2. Due to size and weight restrictions we
are using bh PMZ-100-1 PMT modules. The active area of the detectors has 8mm
diameter, thus efficiently recording the photons projected from the microscope
lens to the outputs of the beam splitter assembly.
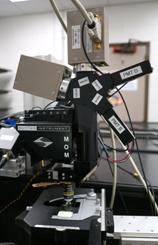
Fig. 2: Two
FLIM detectors attached to outputs 1 and 2 of the MOM beamsplitter assembly
The principle of FLIM recording is
illustrated in the right part of Fig. 1. The FLIM recording is synchronised
with the laser via its Sync out signal, and with the scanner via its pixel,
line, and frame clock pulses. For every photon, the TCSPC electronics
determines the time within the laser pulse period and the location of the laser
focus in the sample in the moment of its detection. The instrument software
uses this information to build up a photon distribution over the x and y
coordinate of the scan area, and the times of the photons within the laser
pulse period. The result is identical with an array of pixels over x and y,
each containing a fluorescence decay function in form of photon numbers in
consecutive time channels [1, 2]. TCSPC FLIM delivers a near-ideal recording
efficiency and an extremely high time resolution. Normally, the recording
process is run over a large number of frames of the scan. The result is then
independent of the scan rate. The signal-to-noise ratio only depends on the
photon rate delivered by the sample, and on the total acquisition time.
More parameters can be added to the photon
distribution, such as the wavelength of the photons, the wavelength of several
multiplexed lasers, the time from the start of an experiment or from a
stimulation of the sample, or the time within period of a modulation of the
laser. Most of these advanced FLIM modes are possible in combination with the
Sutter MOM system but will not be described here. Please see [2] for details.
System Parameter Setup
The bh / Sutter system is controlled both
by the software of the MOM system and the SPCM software of the TCSPC system.
The MOM software controls the microscope and the scanner, the SPCM software the
data acquisition. The synchronisation between the two system components is
performed entirely by the scan clock signals. Start and stop of a measurement
is coupled with the frame pulse. No matter whether the scanning or the
acquisition is started first - the recording always starts and ends with a
frame clock.
MOM Software Parameters
Fig. 3 shows the MOM main panel. Operation
mode for FLIM is XY Movie, the laser power and the laser wavelength are
selected in the middle. Image position, image rotation and focus position are
selected on the right.
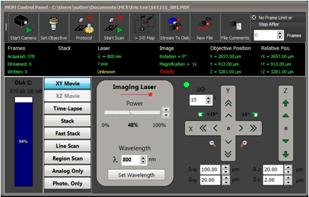
Fig. 3: Main
panel of MOM software
The details of the scanning are controlled
via the Protocol panel. Settings for different FLIM pixel numbers are shown
in Fig. 4, left, middle, and right. The number of pixels in the FLIM recording
is 1/2 of the pixel number of the MOM scan. The reason is that the MOM runs a
bidirectional scan along the lines. The bh FLIM systems can, in principle,
record FLIM with a bidirectional scan [5]. However, in a bidirectional scan the
scanner lag causes an offset between the forward and the backward scan. The
resulting line shift can, in principle, be compensated in SPCM. This requires,
however, that the shift and its dependence from the imaging parameters are
accurately known. Since this is not (yet) the case for the MOM system the FLIM
system uses only the forward scan for recording. The number of lines of the
FLIM recording is therefore 1/2 of the number of lines in the scan. Fig. 4,
left, middle, and right show MOM settings for FLIM recordings of 256x256,
512x512, and 1024x1024 pixels, respectively. The MOM can also run a
bidirectional Y scan (Symmetric Y Scan). This option must be disabled for FLIM
recording.
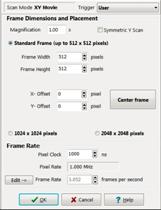
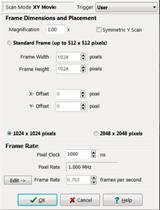
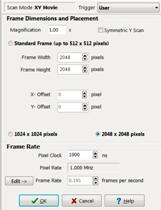
Fig. 4:
Protocol panel of MOM software. Left to right: For FLIM images of 256x256,
512x512, and 1024x1024 pixels.
Magnification is identical with the
Zoom factor in other scanning microscopes. It is reversely proportional to
the amplitude of the scan. A smaller amplitude results in a smaller scan area,
and thus of a higher magnification. The FLIM system automatically records an
image of the correct size, because the recording is synchronised via the pixel
and line clocks. An image with higher Magnification simply has smaller
pixels.
SPCM system parameters
The general function of the SPCM parameters
is described in [2]. A suitable setup for a FLIM pixel number of 512 x 512
is shown in Fig. 5, left. Note that the setup requires a pixel number of 1024 x 1024
in the MOM software, see above. FLIM pixel formats of 256 x 256 and 1024 x
1024 can be used as well. They require MOM pixel numbers of 512 x 512
and 2048 x 2048, respectively. The number of time channels (ADC
Resolution) for FLIM recordings of 1024 x 1024 pixels can be up to 1024,
for the smaller image formats even up to 4096.
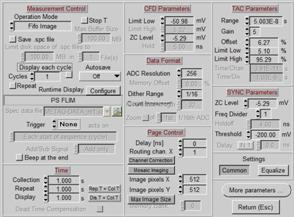
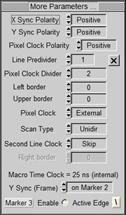
Fig. 5: SPCM
Main panel (left) and More Parameters panel with scan interface parameters
(right)
For the coupling with the MOM the scan interface
parameters are important. They are accessible via More parameters, see Fig. 5,
right. Line predivider is 1, pixel clock predivider is 2. Scan Type must be
unidirectional, Second Line Clock is set to skip.
Please note that these settings need not be
defined every time you change the image sizes. The parameter sets are just
defined once, and then put into a panel of predefined setups. From there, they
can be loaded into the system by a single mouse click [2].
For setup of the SPCM display please see [2],
Display Parameters and 3D Trace Parameters. Since September 2016 SPCM has a
fast online FLIM display function, please see [4].
Typical Results
Fig. 6 shows a FLIM image of a Convallaria
sample. The FLIM data were recorded with 1024 x 1024 pixels.
The spatial resolution of the data is
excellent. No out-of-focus blur or ghost images are seen. Decay curves in two
selected pixels are shown in Fig. 6, right. The decay data are clean, without
any traces of optical reflections, leakage of excitation light, or other
imperfections.
The convallaria image demonstrates the
image quality of the bh / MOM system. Due to its high fluorophore concentration
and low scattering it is, however, not representative of a typical FLIM sample.
A more typical sample is shown in Fig. 7. It shows a salmon louse (Lepeophtheirus
Salmonis), a parasite that lives and feeds on salmons. It causes
substantial economic damage in salmon farms, and studying its life cycle and
metabolism is of practical interest. The sample was excited at 750 nm, and
the fluorescence was measured in the interval from 440 to 480 nm. The
fluorescence in this interval mainly comes from NADH and Keratin. As can be
seen from Fig. 7, the FLIM data are extremely rich in detail. The biological
meaning of the data and possible changes with the metabolic state remain
subject of further investigation.
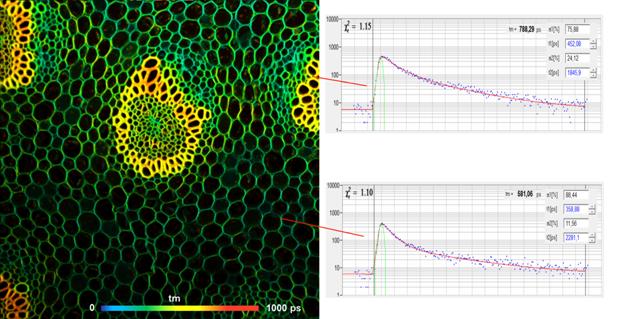
Fig. 6: Left: FLIM image of a convallaria sample, 1024x1024 pixels. Excitation
wavelength 800 nm, detection wavelength 510 to 550 nm.
Double-exponential decay model, amplitude weighted lifetime of decay
components. Right: Decay curves in selected pixels.
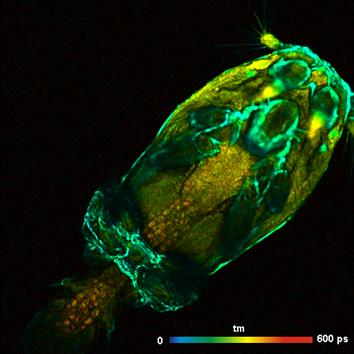
Fig. 7:
Salmon louse (Lepeophtheirus Salmonis), 512 x 512 pixels. Autofluorescence,
excitation wavelength 750 nm, detection wavelength 440 to 480 nm.
Amplitude-weighted lifetime of double-exponential decay.
Remarks
As an argument against the use of FLIM at
the MOM microscopes it is sometimes stated that the movable-objective function
causes an unpredictable shift of the decay data and thus errors in the recorded
fluorescence decay times. This is not correct. bh SPCImage data analysis uses a
synthetic IRF that is calculated from the decay data themselves [2]. The
results are thus independent of a possible change in the optical path length.
If a measured IRF has to be used for whatever reason it should be recorded with
the same objective position as the FLIM data. Of course, the FLIM setup
parameters must guarantee that the decay curves stay within the time interval
recorded by the FLIM system. The transit time changes caused by an objective
move are in the range of a few 100 ps, so this is not a problem.
As all non-descanned detection systems, the
MOM is prone to pick up environment light. This is caused by the fact that
non-descanned detection collects photons from a large area of the sample.
Daylight background substantially reduces the accuracy of fluorescence
lifetimes derived from FLIM data, and has therefore to be avoided. The
microscope must be completely covered, and operated in darkness or under dimmed
light. A large amount of light can also enter the microscope lens through the
sample, from the bottom of the microscope. We therefore recommend to cover the
back of the sample when FLIM is recorded.
Conclusions
The combination of the bh TCSPC-FLIM system
with the Sutter MOM microscope is an efficient and flexible solution to fluorescence
lifetime imaging of live cells and live tissues. The instrument can be operated
with up to four parallel FLIM channels, each recording FLIM images with up to
1024x1024 pixels and 1024 time channels per pixel. Multiphoton excitation and
non-descanned detection make the system especially useful for FLIM of live
cells and tissues. Typical applications are metabolic imaging by recording the
fluorescence of NADH and FAD, protein interaction experiments by FLIM-FRET
techniques, and ion concentration measurements with environment-sensitive
fluorescent dyes.
References
1. W. Becker, Advanced Time-Correlated Single-Photon Counting Techniques. Springer,
Berlin, Heidelberg, New York, 2005
2. W. Becker, The bh TCSPC Handbook. 9th edition, Becker & Hickl
GmbH (2021), available on www.becker-hickl.com
3.
W. Becker, V. Shcheslavskiy, H. Studier, TCSPC FLIM with Different
Optical Scanning Techniques, in W. Becker (ed.) Advanced time-correlated
single photon counting applications. Springer, Berlin, Heidelberg, New York
(2015)
4. Becker & Hickl GmbH, SPCM Software Runs Online-FLIM at 10 Images
per Second. Application note, available on www.becker-hickl.com
5. Becker & Hickl GmbH, SPC Modules Record FLIM with Bidirectional
Scanning. Application note, available on www.becker-hickl.com
6. Sutter Instrument, Movable Objective Microscope.
www.sutter.com/microscopes
Contact:
Wolfgang Becker
Becker & Hickl GmbH
Berlin, Germany
becker@becker-hickl.com
www.becker-hickl.com
