bh - Abberior Combination Records STED FLIM
at Megapixel Resolution
The
combination of the Abberior STED system [1] with the bh Simple-Tau 150/154
TCSPC FLIM system [3] records FLIM data at a spatial resolution of better than 40 nm.
The image format can be as large as 2048 x 2048 pixels with 256 time
channels per pixel. An image area of 40 x 40 micrometers can
thus be covered with 20 nm pixel size, fully satisfying the Nyquist
criterion. With smaller numbers of time channels even larger pixel numbers are
possible. The system especially benefits from Windows 64 bit technology used
both in the Abberior and in the bh data acquisition software, from the combined
processing power of the two system computers, and the high data throughput of
up to four parallel TCSPC FLIM channels. The system achieves peak count rates
in excess of 5 MHz per FLIM channel, resulting in unprecedented signal-to-noise
ratio and short acquisition time.
FLIM Recording Principle
The FLIM system is coupled to the Abberior
STED microscope in the usual way. The FLIM recording is synchronised with the
scanning via pixel clock, line clock, and frame clock signals. The
single-photon pulses are split off from the detector signals by an active
signal splitter. The Abberior system and the bh system thus record in parallel,
using the same photons detected in the same detectors. The FLIM recording
process builds up a photon distribution over the scan coordinates, x and y, and
the photon times after the excitation laser pulse, t. The result is an array of
pixels, each containing a full fluorescence decay curve in a large number of
time channels [3]. The result is independent of the scan rate, only the total
acquisition time matters. The FLIM system automatically records images of the
same scan area as it is selected in the Abberior system. By using Windows
64-bit technology both in the Abberior and in the bh data acquisition software
FLIM images with Megapixel resolution can be recorded. Typical data formats are
1024x1024 pixels, 1024 time channels, 2048x2048 pixels, 256 time channels, or
4096x4096 pixels, 64 time channels.
There are several possible implementations
of bh FLIM in the Abberior STED systems. A bh TCSPC FLIM module can be put in
the Abberior system computer and operated via the Abberior software [5],
several TCSP FLIM modules can be placed in an extension box and coupled to the
Abberior system computer by a bus extension cable, or a stand-alone bh FLIM
system with one, two, three or four FLIM cards can be connected to the Abberior
system via the detector signals and the scan clocks. Here we report on the
third implementation.
Time Gating
STED is based on the excitation of the
sample by a pulsed excitation laser, and subsequent depletion of the
fluorescence by stimulated emission induced by a (normally also pulsed)
depletion laser. The wavefront of the depletion laser is manipulated such that
its Airy disc has a hole in the middle where the intensity is zero. Due to the
nonlinear nature of the stimulated emission process the diameter of the whole
can be far smaller than the diameter of the normal Airy disc. A fluorescence
image taken from the remaining fluorescence after depletion thus has optical
super-resolution [7]. Because
the depletion does not happen instantaneously best results are obtained by
time-gating the detection system, i.e. by recording only the part of the fluorescence
after the depletion pulse. In the FLIM system time gating can be achieved by
three different ways.
The bh TCSPC modules have discriminators in
their TAC circuitry to reject photons outside a selectable time interval. The
parameters to select this interval are TAC Limit High and TAC Limit Low [3].
The parameters can easily be adjusted by running the modules in the
Oscilloscope mode, and reducing TAC Limit High until the initial peak of the
decay curve (the un-depleted fluorescence) is rejected. Gating by the TAC
limits is easy but has the disadvantage that the time window cannot be adjusted
off-line in the recorded data. A second way is to use the 3-dimensional display
features of the bh SPCM software. The SPCM software displays images in up to 8
selectable time windows. The windows are defined in the Window Parameters,
the actual window is selected in the Display Parameters. Several images for
different time windows can be displayed. The window selection acts only on the
display, not on the data themselves. Time gates can therefore be selected also
in recorded data [3]. The most convenient way of time gating is, however, to
use the Gated Intensity option in the bh SPCImage FLIM data analysis. A time
window is selected in the decay curves, and the intensity of the image is taken
from the photons inside the selected window [3]. This approach was used for the
image shown below.
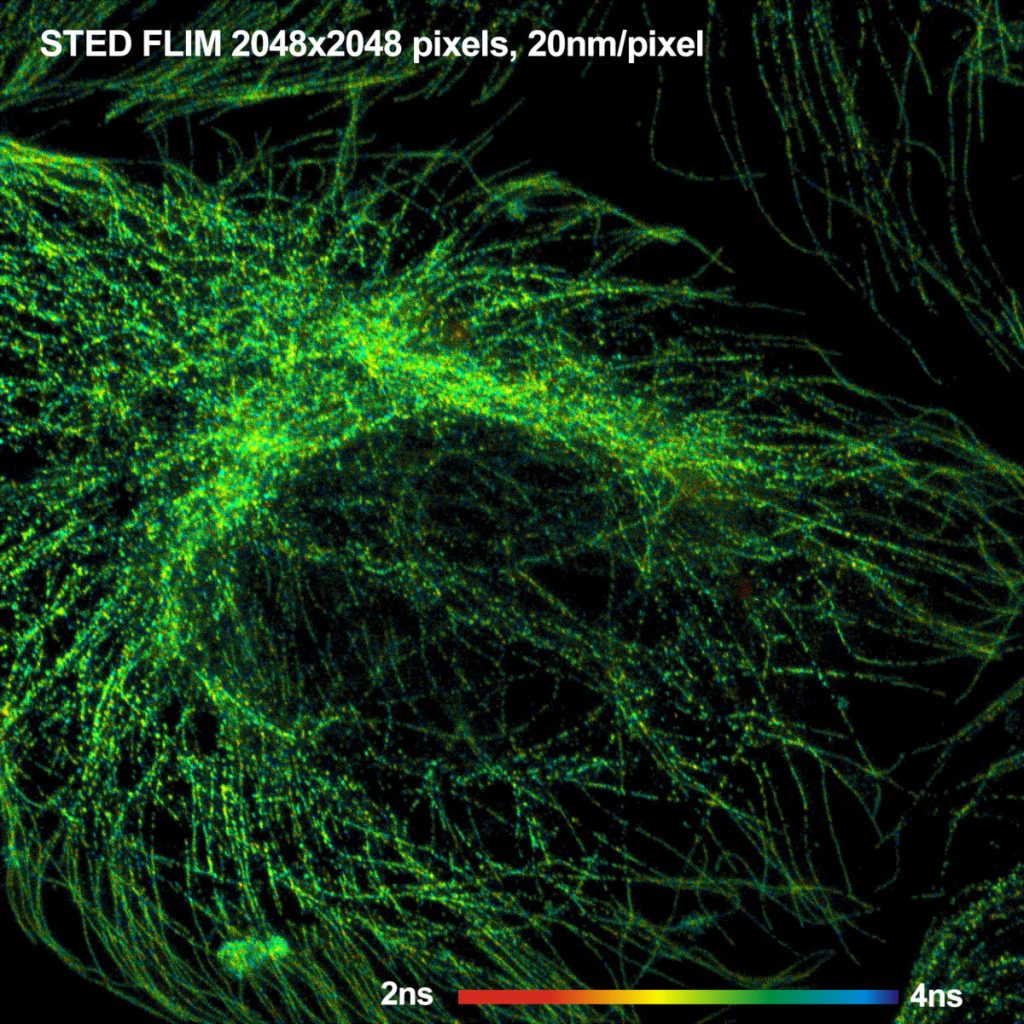
Typical Result
A FLIM image of the microtubules in a BPAE
cell is shown in Fig. 1. The image has 2048 x 2048 pixels, and 256
time channels per pixel. Please use the Adobe zoom function to see the image at
full resolution.

Fig. 1: Tubulin fibres in a BPAE cell. Use Adobe zoom function to see
image at full resolution.
The image was acquired at an (average)
count rate of about 1.5 MHz, and within an acquisition time of about 2 minutes.
The scan rate was 1µs per pixel, or 1 frame in 4 seconds. Remarkably, no
decrease in the count rate was observed within this time. That means there was
no significant photobleaching.
The fluorescence decay in a selected pixel
is shown in Fig. 2. The shape of the decay is typical for STED. There is an
initial peak of un-depleted fluorescence from the entire airy disc of the
excitation laser, followed by the fluorescence decay function from the
molecules in the hole of the depletion disc. The intensity for the image
shown in Fig. 1 was taken from the time interval between the cursors, the
fluorescence decay fit was performed in the same time interval.
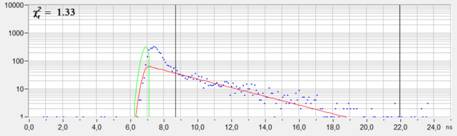
Fig. 2: Decay curve in selected spot of the STED FLIM image. The
fluorescence intensity and the fluorescence decay time was derived from the
time interval after the peak of the un-depleted fluorescence.
Discussion
The combination of the Abberior STED system
with the bh FLIM modules delivers STED FLIM data of excellent spatial
resolution. The images are recorded at pixel numbers in the megapixel range,
allowing images of a whole cell to be recorded at Nyquist-compatible pixel
size. Images are recorded within remarkably short acquisition time, and with
very low photobleaching. The data structure is the same as for normal FLIM. The
data can thus be analysed by bh SPCImage FLIM analysis software, allowing both
for lifetime analysis and time-gating the intensity.
Although STED FLIM is around for more than 8
years [2], applications so far have mostly been restricted to the use of the
fluorescence lifetime as a discrimination parameter for different fluorophores
[6]. This is not the most
important or most frequent application of FLIM. FLIM is rather focusing at the
use of the fluorescence lifetime as an indicator of the molecular environment
of the fluorophore molecules [4]. There are three main groups of such
applications - detection of molecular parameters like ion concentrations, pH,
oxygen concentration, or local viscosity, protein interaction experiments by
FRET, and metabolic imaging by analysing the fluorescence decay components of
NADH and FAD. Most of the applications have in common that there are two decay
components of the same fluorophore - a fraction bound to an ion and a free
fraction, a protonated and deprotonated fraction, an interacting FRET donor
fraction and a non-interacting one, or a bound and an unbound NADH or FAD
fraction. The desired information is in the amplitudes and the lifetimes of the
components. Usually, the fast decay components have lifetimes on the order of a
few 100 ps to 1 ns. This poses a problem to STED. If the fast decay
component gets hidden in the undepleted-fluorescence peak it cannot be detected.
Even the effect of variable amplitude and lifetime of the fast component on the
apparent lifetime is lost. The solution is to use excitation and depletion
lasers with sufficiently short pulses and faster detectors. Currently used
lasers are probably fast enough, but there is need for improvement on the
detector side. With hybrid detectors the IRF width can be reduced from
currently about 500 ps down to 120 ps, with shallow-junction SPADs
down to 30 to 40 ps. The STED peak could then easily be separated from the
fast decay component, and changes in the lifetimes and the relative amplitudes
of the decay components become detectable.
References
1.
Please see www.abberior-instruments.com
2. E. Auksorius, B. R. Boruah, C. Dunsby, P. M. P. Lanigan, G. Kennedy,
M. A. A. Neil, P. M. W. French, Stimulated emission depletion microscopy with a
supercontinuum source and fluorescence lifetime imaging. Opt. Lett. 33, 113-115
(2008)
3. W. Becker, The bh TCSPC handbook. 6th edition, Becker & Hickl
GmbH (2015), available on www.becker-hickl.com
4. W. Becker (ed.) Advanced time-correlated single photon counting
applications. Springer, Berlin, Heidelberg, New York (2015)
5. bh SPC-150 modules record super-resolution FLIM in Abberior STED
FLIM microscopes. bh-news 2015-09, see www.becker-hickl.com/bhnews.htm
6. J. Bückers, D. Wildanger, G. Vicidomini, L. Kastrup, S.W. Hell,
Simultaneous multi-lifetime multi-colour STED imaging for colocalization
anlysis. Opt. Expr. 19, 3130-3143 (2011)
7. S. W. Hell, J. Wichmann, Breaking the diffraction resolution limit
by stimulated emission: stimulated-emission-depletion fluorescence microscopy.
Opt. Lett. 19, 780-782 (1994)