Online STED FLIM with bh - Abberior
Combination
The
combination of the Abberior STED system with the bh SPC-150 or SPC-160 TCSPC
FLIM modules records FLIM data at a spatial resolution of better than 40 nm
[1, 2, 3]. The image format can be as large as
2048 x 2048 pixels with 256 time channels per pixel. Since July 2016
the bh the SPCM data acquisition software has an online display function for
fluorescence lifetime images [4]. The function can be used to display STED FLIM images during the
acquisition of the data.
Online Lifetime Display
Online lifetime display is based on the
calculation of the first moment, M1, of the decay data in the individual pixels
of a lifetime image [4]. First-moment calculation delivers the fluorescence lifetime at
near-ideal photon efficiency. High-quality lifetime images are thus obtained even
at a low number of photons per pixel. The implementation of the M1 algorithm
in the bh SPCM data acquisition software is able to calculate a megapixel-size
lifetime image in less than 100 ms. Importantly, the algorithm is running
on normal FLIM data with 256 or 1024 time channels per pixel. Online display
therefore does not conflict with precision offline multi-exponential FLIM analysis
- the FLIM data are still recorded and saved at full time resolution. An
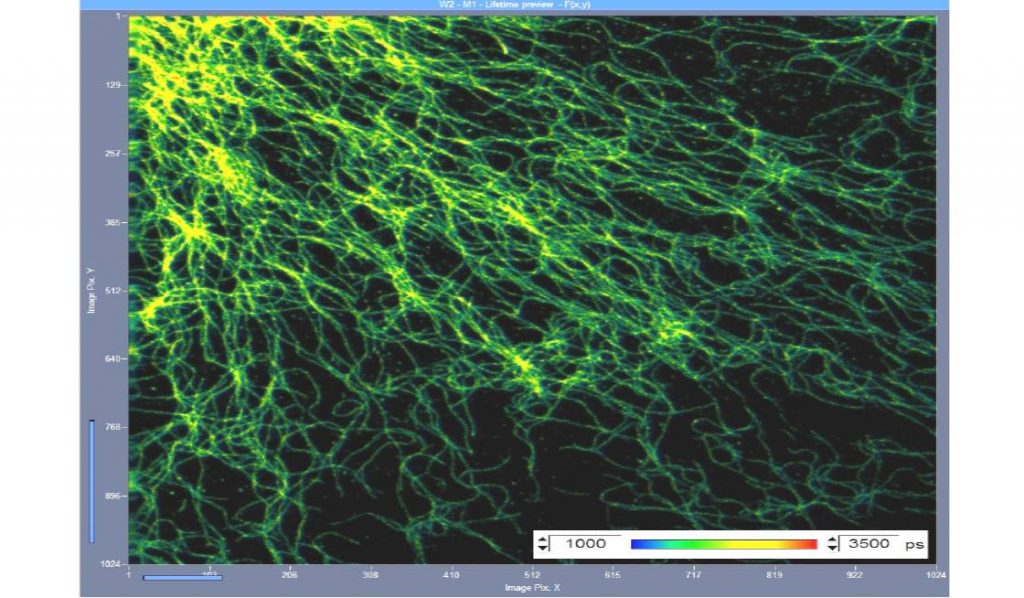
example of a STED FLIM image obtained by the online FLIM function is shown in Fig.
1.

Fig. 1: STED FLIM image displayed by the online-lifetime function of SPCM.
Micro-tubules in a bovine pulmonary artery cell.
Discussion
Influence of the depletion component
The decay curves of STED FLIM contain the
normal decay function of the fluorophore plus a fast component from the
depletion of the fluorescence in the outer part of the Airy disc by the STED
laser. The M1 calculation delivers an intensity-weighted sum of the moments of
the fluorescence decay and the depletion component. The presence of the
depletion component causes a linear shift of the calculated lifetimes towards
shorter decay times. A lifetime variation of the fluorophore (due to variation
in the molecular environment) is thus correctly represented as a similar
variation in the M1 data. If absolute lifetime values are to be displayed by
the online FLIM function this can be obtained by using a modified reference
moment in the online FLIM display parameters. Please see [4] for details.
Time-Gated STED Images
Time-gating rejects fluorescence from the
undepleted part of the fluorescence decay, and thus increases the contrast of
STED images [5]. In the Abberior system the STED depletion for most
fluorophores works so well that the gain in contrast and resolution is barely
visible. Nevertheless, time-gating can be achieved by defining appropriate
Window Intervals in the SPCM software and displaying images in the defined
time windows [2]. Time-gating acts both on online-intensity images and online-lifetime
images. Since the FLIM system records a full set of decay data a over the pixels
the gate position can even be adjusted after the acquisition. A comparison of an
ungated image with a gated one is shown in Fig. 2.


Fig. 2: Ungated (left) and gated online-FLIM image (right). Detail from
the data in Fig. 1.
Acknowledgement
The data presented in this application note
were recorded at the 2nd International Workshop on Advanced Time-Resolved
Imaging Techniques at BioCev, Vestec near Prague , May 16-17, 2017. We thank
Marie Olsinova of BioCev for running the demonstrations and, in particular, for
recording data of extraordinary quality.
References
1.
Please see www.abberior-instruments.com
2. W. Becker, The bh TCSPC handbook. 6th edition, Becker & Hickl
GmbH (2015), available on www.becker-hickl.com
3. Becker & Hickl GmbH, bh - Abberior Combination Records STED FLIM
at Megapixel Resolution. Application note, available on www.becker-hickl.com
4. Becker & Hickl GmbH, SPCM Software Runs Online-FLIM at 10 Images
per Second. Application note, available on www.becker-hickl.com
5. E. Auksorius, B. R. Boruah, C. Dunsby, P. M. P. Lanigan, G. Kennedy,
M. A. A. Neil, P. M. W. French, Stimulated emission depletion microscopy with a
supercontinuum source and fluorescence lifetime imaging. Opt. Lett. 33, 113-115
(2008)
Contact:
Wolfgang Becker
Becker & Hickl GmbH
Berlin, Germany
Email: becker@becker-hickl.com


