Multiphoton Multiwavelength
NDD FLIM
Multiphoton Multiwavelength
NDD FLIM
with Zeiss LSM 710 NLO
Abstract. The bh multi-wavelength FLIM systems use
multi-dimensional TCSPC to detect FLIM simultaneously in 16 wavelength
channels. The fluorescence light is split spectrally by a grating polychromator,
the spectrum is projected on a 16-channel PMT,
and for each photon a timing signal and a channel-identification signal
is generated. The TCSPC module builds up a photon distribution over the time in
the signal period, the wavelength and the location of origin of the photons in
the scan area. The result is 16 FLIM data sets for the 16 wavelength intervals
detected by the 16-channel PMT.
Introduction
TCSPC multi-wavelength FLIM is based on the
detection of individual photons of the fluorescence light, the characterisation
of each photon by its time in the laser pulse period, its wavelength, and its
location of origin in the scan area of the microscope [1, 2]. The
recording process builds up the distribution of the photon number over these
parameters. The result is a number of FLIM images detected simultaneously in
different wavelength intervals [4].
The recording process is illustrated by Fig. 1. The fluorescence signal is split spectrally by a grating
polychromator. The spectrum is projected on a 16-channel PMT [3]. The output pulses of the PMT
channels are combined into a common timing pulse line. The TCSPC module uses
this signal to determine the arrival time, t,
of a detected photon. Simultaneously, a routing electronics block in the
detector module determines the channel of the PMT in which the photon was
detected. The channel number translates directly into the wavelength of the
photon, l. The last two pieces of
information come from a scanning interface that delivers the location of the
laser beam, x, y, in the moment when the photon was detected.
Fig. 1: Principle
of multi-wavelength TCSPC FLIM
A photon
distribution built up over these parameters can be considered an array of
pixels, each of which contains a number of fluorescence decay curves for
different wavelength. It should be noted that the recording process does not
use and time gating or wavelength scanning. Thus, all photons seen by the
detector contribute the buildup of the FLIM data, resulting in a near-ideal
recording efficiency.
Multi-wavelength TCSPC FLIM can easily be
combined with confocal detection. The light from the pinhole would be focused
either directly into the entrance slit of the polychromator or into an optical
fibre that is connected to the slit plane [5].
However, if multi-wavelength FLIM is used with multiphoton excitation and
non-descanned detection (NDD) the situation is not that easy. NDD is used to
collect light from deep sample layers. Photons from these layers are scattered
on their way out of the sample. They cannot be collimated or focused into a
small spot, and, in particular, not be focused into the narrow slit of the
polychromator. The best spot that can be achieved is a de-magnified image of
the microscope objective lens [7]. The problem in combination with the polychromator
is that either the spot is larger than the slit width, or the f number of the
light bundle becomes larger than the f ratio the polychromator accepts, see Fig. 2. In both cases a large fraction of the photons is
lost.
Fig. 2: Problem of spectral dispersion at an NDD port: Either the spot
diameter is larger than the slit width of the polychromator (left) or the f
number of the light bundle is larger than the f number the polychromator
accepts.
We therefore use a fibre bundle to transfer
the light from the NDD port of the microscope into the polychromator. The
principle is shown in Fig.
3.
Fig. 3: The light from the NDD port is transferred into the polychromator
by a fibre bundle. The fibre bundle transforms the round spot at the NDD port
into a slit at the input of the polychromator.
The input face of the fibre bundle is round.
The diameter matches the diameter of the spot in the detector plane of the Zeiss NDD module or the
Zeiss NDD T Adapter. The output face of the fibre bundle is flat. It is placed
in the input slit plane of the polychromator. Compared to a lens system or a
single fibre, the transformation of the beam cross section results in a
substantially increased light throughput.
Typical Result
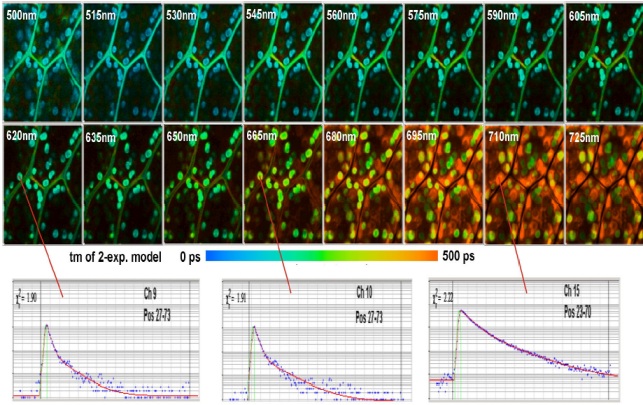
Multi-wavelength FLIM of a moss leaf is
shown in Fig. 4. We used the standard bh TCSPC FLIM electronics for
the Zeiss LSM 710 NLO. The MW-FLIM detector was attached to the 0° output of the
LSM 710 NDD Adapter [6]. We
excited at 850nm, and detected from 500nm to 725nm. The acquisition time was
150 s.
The FLIM data were recorded at 256 time
channels per pixel. A scan format of the LSM 710 NLO was 512x512
pixels was used, and the FLIM data were recorded at 128 x 128 pixels, i.e. a
binning of 4x4 pixels was used. The reason for the binning is data size. FLIM
data are in fact stacks of images for different times in the fluorescence
decay. Multi-wavelength imaging multiplies the data size by the number of
wavelength intervals. With the FLIM format used the complete FLIM data set has
a size of 134 megabytes.
The data of all 16 wavelength intervals were
analysed by using the Analyse All function of the bh SPCImage data analysis
software [6]. The
intensities in the individual images were normalised on the intensity in the
brightest pixel. The colour of the images represents the amplitude-weighted
mean lifetime of a double-exponential fit to the decay data. Fluorescence decay
functions in selected spots of the images of three wavelengths intervals are
shown at the bottom of Fig.
4.
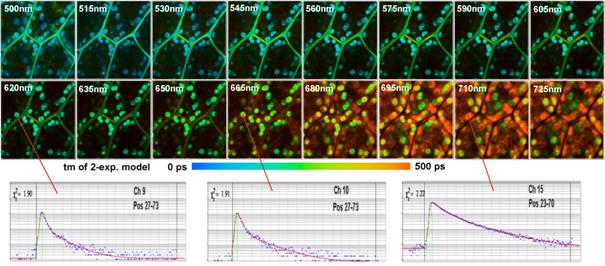
Fig. 4: Multi-wavelength FLIM of a moss leaf. Excitation at 850 nm,
detection wavelengths indicated in the images.
Summary
Multiphoton multi-wavelength NDD FLIM is
possible by using the standard bh FLIM system for the Zeiss LSDM 710 NLO
microscopes with a MW-FLIM multi-wavelength detector assembly. The light from
the LSM 710 NDD port is transferred into the polychromator of the MW-FLIM
assembly by a fibre bundle. The bundle transforms the circular cross-section of
the beam at the NDD output into a narrow slit in the input plane of the
polychromator. Thus, high efficiency is obtained even for photons from deep
layers of the sample. Typical applications of the system are autofluorecence
measurements [8], multi-spectral FRET measurements [9], and experiments of plant physiology.
References
1.
W. Becker, Advanced time-correlated single-photon counting techniques. Springer, Berlin,
Heidelberg, New York, 2005
2. W. Becker, The bh TCSPC handbook,
3rd edition. Becker & Hickl GmbH (2008), www.becker-hickl.com
3.
Becker & Hickl GmbH,
16 channel detector head for time-correlated single photon counting, user handbook,
available on www.becker‑hickl.com, (2006)
4.
W. Becker, A. Bergmann, C.
Biskup, Multi-Spectral Fluorescence Lifetime Imaging by TCSPC. Micr. Res. Tech.
70,
403-409 (2007)
5.
Becker & Hickl GmbH,
DCS-120 Confocal Scanning FLIM Systems, user handbook. www.becker-hickl.com
6.
Becker & Hickl GmbH,
Modular FLIM systems for Zeiss LSM 510 and LSM 710 laser scanning
microscopes. User handbook, available on www.becker-hickl.com
7.
Becker & Hickl GmbH,
Non-Descanned FLIM Detection in Multiphoton Microscopes. Application note,
available on www.becker-hickl.com
8.
D.
Chorvat, A. Chorvatova, Multi-wavelength fluorescence lifetime spectroscopy: a
new approach to the study of endogenous fluorescence in living cells and
tissues. Laser Phys. Lett. 6 175-193 (2009)
9.
C. Biskup, T. Zimmer, L.
Kelbauskas, B. Hoffmann, N. Klöcker, W. Becker, A. Bergmann, K. Benndorf,
Multi-Dimensional Fluorescence Lifetime and FRET Measurements. Micr. Res. Tech.
70, 403-409 (2007)