Principles
Multi-Dimensional TCSPC
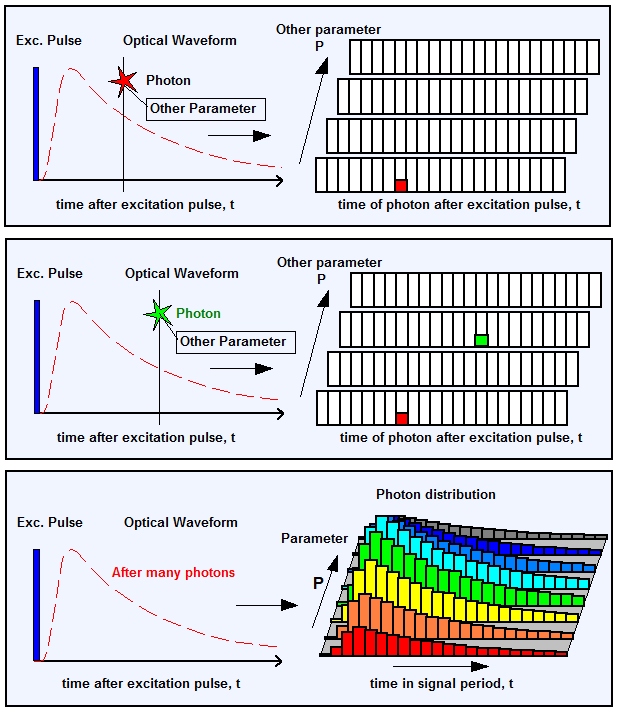
Multi-dimensional TCSPC is an extension of the classic TCSPC technique. It is the basis of TCSPC FLIM, FLIO, metabolic imaging and a large number of FLIM-based molecular imaging techniques. Multi-dimensional TCSPC was introduced by Becker & Hickl (bh) in 1993. For every photon, it determines not only the time in the excitation pulse period but also additional parameters, such as wavelength, direction of polarization, location within an image area, time from a stimulation of the sample, excitation wavelength, and many others which can either be measured or controlled in the experiment setup.
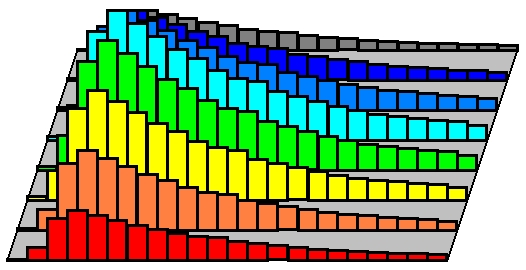
From the times of the individual photons and the parameter values TCSPC builds up a multi-dimensional distribution of the photons over the time after the excitation pulse and the parameter values.
As for classic TCSPC, every photon seen by the detector contributes to the buildup of the photon distribution. Since there is no rejection of photons the recording process works at near ideal efficiency.
Multidimensional TCSPC is the basis of multi-wavelength recording, fast time-series recording, fluorescence lifetime imgaing (FLIM), multi-wavelength lifetime imaging, sinultaneous FLIM / PLIM, and a number of other multi-dimensional techniques of recording fast optical signals.
Example 1: Multi-Wavelength TCSPC
TCSPC build up a photon distribution over the times and the wavelength of the photons. The result is a set of decay curves for different wavelength.
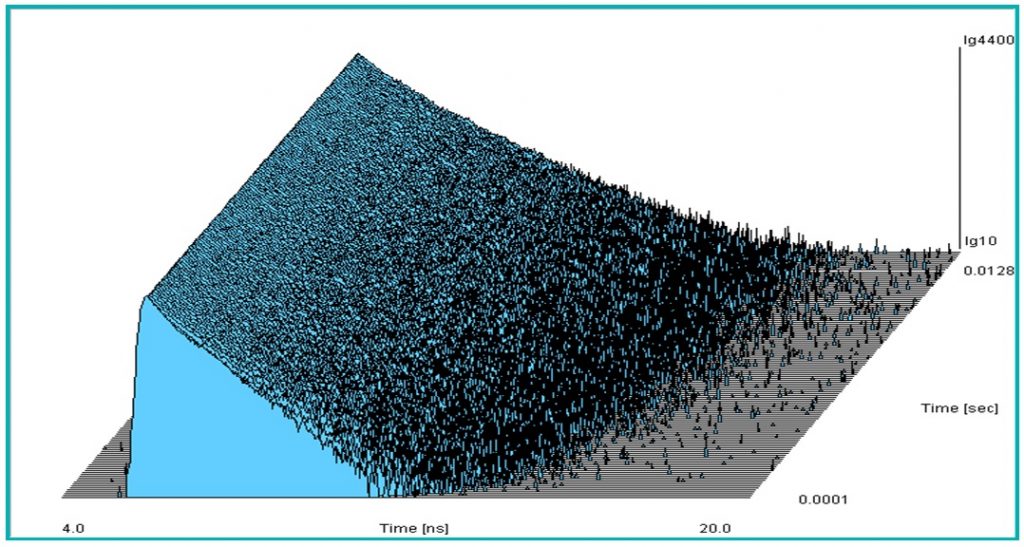
Example 2: Accumulation of ultra-fast time series
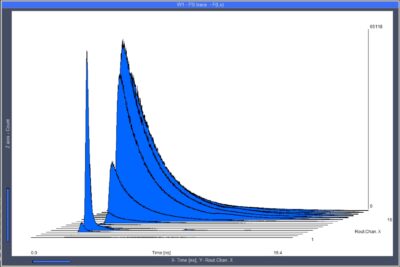
TCSPC build up a photon distribution over the times of the photon after the excitation pulses and after a stimulation of the sample. The example shows the photochemical transient of chlorophyll in a plant. Time per curve is 100 microseconds.
Example 3: FLIM
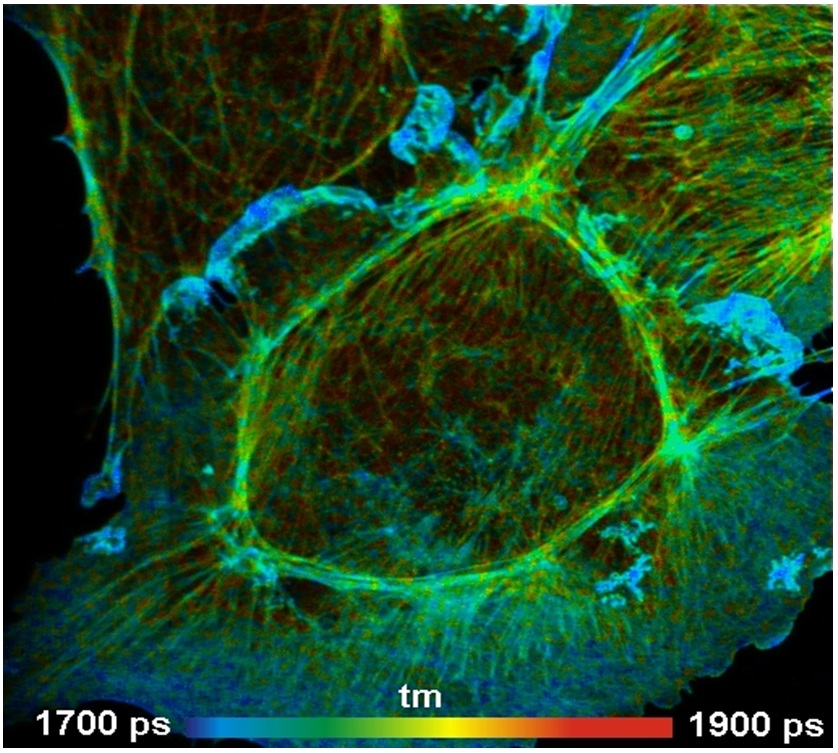
TCSPC builds up a photon distribution over the times of the photons and the position of the laser spot in a scanning area in the moment of the photon detection. The result is a pixel array with a fluorescence decay curve in each pixel. FLIM data are displayed as colour-coded images of the fluorescence lifetime or another parameter of the fluorescence decay function.
