bh
FLIM: More than Fluorescence-Lifetime Imaging
From Basic FLIM to High-End Molecular Imaging
bh FLIM systems record FLIM images of
unprecedented temporal and spatial resolution at an accuracy level close to the
theoretical limit given by photon statistics [1, 23]. But bh FLIM systems do
more that that: The bh FLIM technique is based on a new understanding of FLIM
in general [2]. FLIM is not just considered a way to add additional contrast to
microscopy images. It is considered and designed as a molecular imaging
technique. bh FLIM exploits the fact that the fluorescence decay function of a
fluorophore is an indicator of its molecular environment, and that
multi-exponential decay analysis delivers molecular information, such as the
metabolic state of live cells and tissues, protein conformation and protein
interaction, reaction of cells to drugs and molecular environment, or mechanisms
of cancer development and cancer progression. To reach this target, bh FLIM
systems have features not available by other systems: Compatibility with
live-cell imaging, extraordinarily high time resolution and photon efficiency,
capability to split decay functions into several components, excitation-wavelength
multiplexing in combination with parallel-channel detection, recording of
dynamic lifetime effects caused by fast physiological effects, and simultaneous
FLIM/PLIM [2]. The most important ones of these features will be described in
this brochure.
Precision Megapixel FLIM Images
bh FLIM is characterised by spatial
resolution in the megapixel range and temporal resolution in the 10-ps range. An
example is shown below.
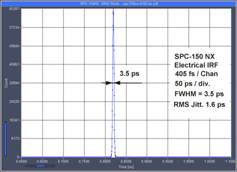
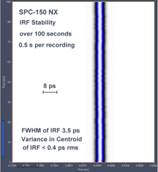
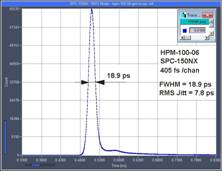
The Ultimate in FLIM Time Resolution and Timing Stability
The electrical time resolution of the bh
FLIM modules is 3.5ps fwhm, or about 1.5 ps rms [2]. Timing stability is better
than 0.4ps rms. The system IRF of multiphoton systems is <19 ps fwhm,
or 8.3 ps rms, including detector and laser. No need to record an IRF for
a system this fast!
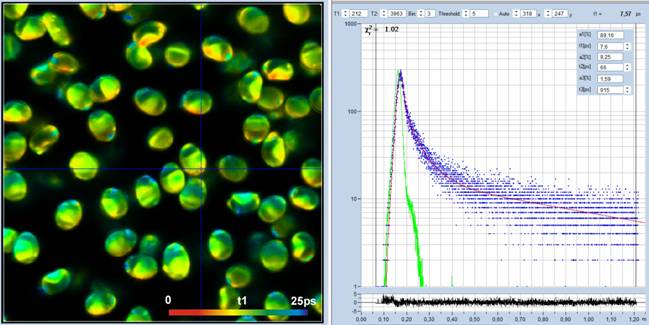
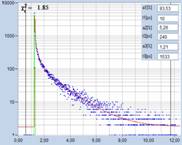
Ultra-High Resolution FLIM
Ultra-short decay times in biological
systems are more frequent than commonly believed. They are often considered
difficult or impossible to measure. However, lifetimes in the 10-ps range are
no problem for bh FLIM systems. The data below were recorded at a time-channel
width of 300 femtoseconds, and with an IRF width of 19 ps [7]. The dominating decay component has a
lifetime of 7.6 picoseconds.
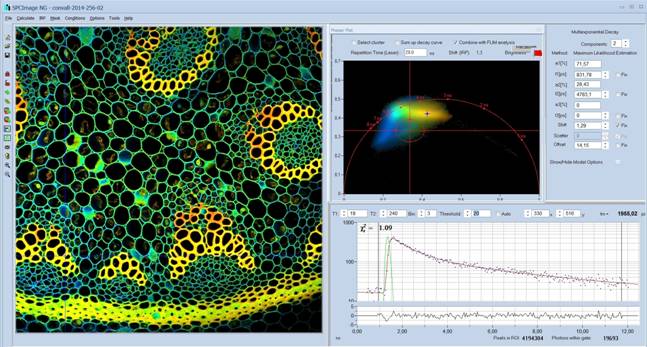
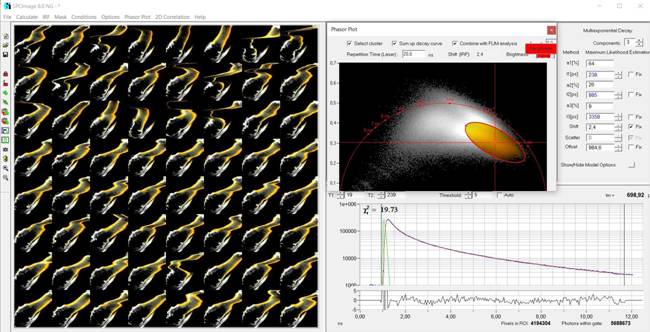
FLIM Data Analysis by SPCImage NG
Data analysis is an integral part of the bh
FLIM systems [2, 24]. GPU processing,
MLE fit, multi-exponential analysis, combination with phasor plot, automatic
IRF synthesis - these are the main features. Precision multi-exponential decay analysis
occurs within seconds, MLE yields high fit stability, no reference measurement
is needed, and the combination with phasor analysis allows the user to obtain
precision lifetimes for low-intensity data by image segmentation. Biologically
relevant parameters, such or FRET intensities and FRET distances, ion
concentrations, membrane potentials, and metabolic ratios are directly available
from the decay data.
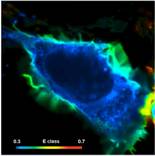
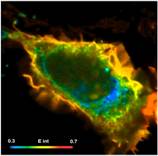
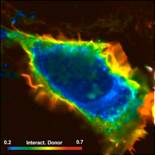
Protein Interaction - Quantitative FRET Results
Precision FLIM-FRET is performed by double-exponential FRET analysis.
In contrast to single-exponential techniques, the method delivers correct FRET
efficiencies and FRET distances [8] even for incomplete donor-acceptor linking,
and without reference measurement of a donor-only sample [9]. The classic FRET
efficiency, the FRET efficiency of the interacting donor, the amount of
interacting donor, and the donor-acceptor distance are displayed directly by
SPCImage NG [2].

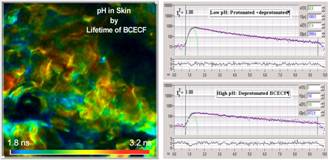
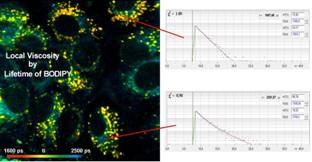
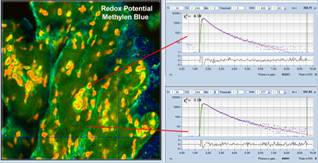
Molecular Parameters - Derived from Fluorescence-Decay Data
Molecular parameters, such as local pH, ion
concentrations, local viscosity or redox potential are available through
precision decay analysis [2]. The results are quantitative, i.e. independent of
the laser power, the fluorophore concentration, and the parameters of the optical-system.
Examples are shown below.
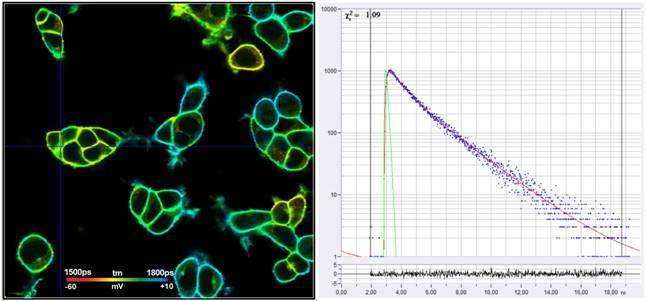
Membrane Potential
Membrane potentials can be measured by FLIM
of voltage sensitive dyes. The lifetime change over the physiological range of
membrane potentials is not very large but can well be resolved by bh's TCSPC
FLIM systems [10].
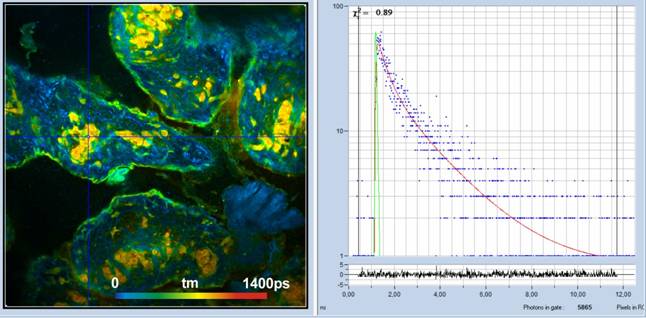
Label-Free Multiphoton Imaging of Cells and Tissues
Use high-resolution multiphoton FLIM to record
label-free FLIM from deep layers of biological tissue. Benefit from high penetration
depth, high image contrast and from the metabolic information contained in the
data [2].
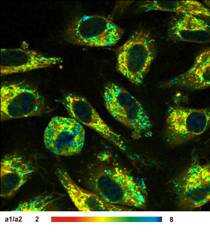
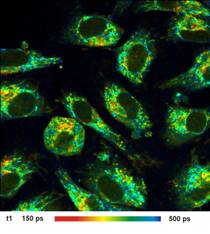
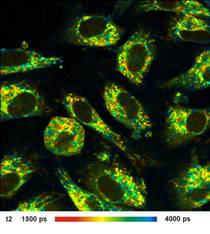
Metabolic Imaging by FLIM of NADH
Record multi-exponential decay parameters
of unbound and bound NADH. Component lifetimes and component amplitudes bear
information on the metabolic state of cells and tissues [2].
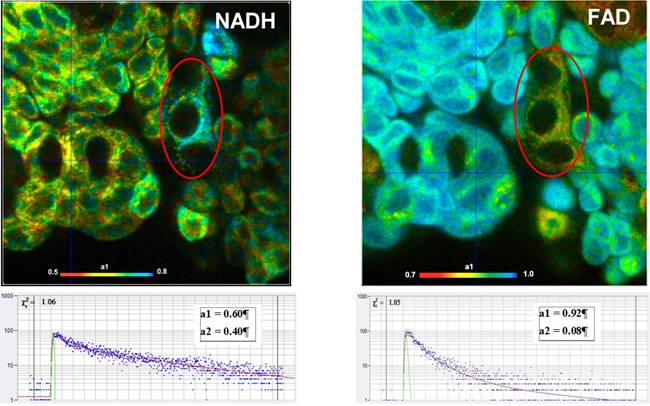
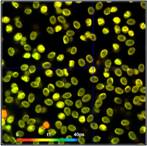
Metabolic FLIM of NADH and FAD by Laser Multiplexing - Increased
Reliability of Tumor Detection
Record Metabolic FLIM by
excitation-wavelength multiplexing and simultaneous imaging of NADH and FAD. Benefit
from perfect separation of NADH and FAD. Discriminate tumor cells from good cells
via the amplitudes of decay components [12, 13]. Below: Human bladder cells,
amplitude image, tumor cells marked.
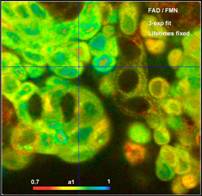
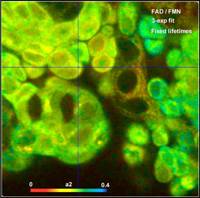
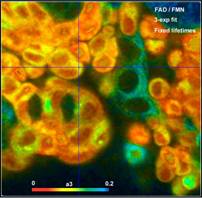
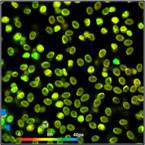
FMN in Cells
Distinguish FMN from FAD by
triple-exponential decay analysis [14]. Below: Relative concentration of bound
FAD, free FAD, and FMN in human bladder cells.
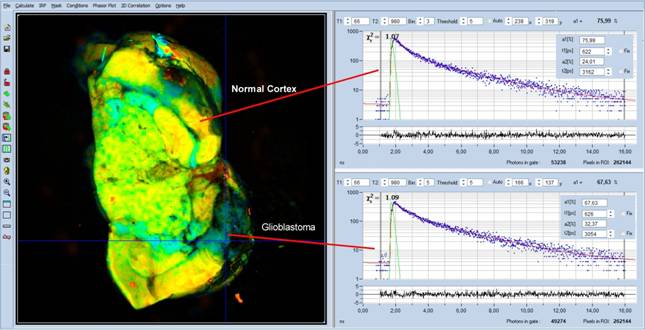
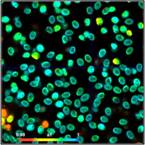
Metabolic FLIM of Macroscopic Objects
Record metabolic FLIM of macroscopic
objects [15]. Below: FLIM image of a whole rat brain. Colour parameter is amplitude
of fast decay component, a1, characterising the metabolic state of the tissue [16].
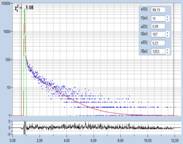
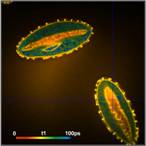
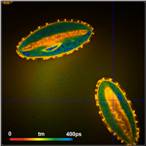
Ultra-Fast Decay Processes in Biological Material
Explore fluorescence-decay processes which
have never been seen before [17, 18, 19]. Below: Mushroom spores and pollen
grains, fast decay component of 10 to 11 ps.

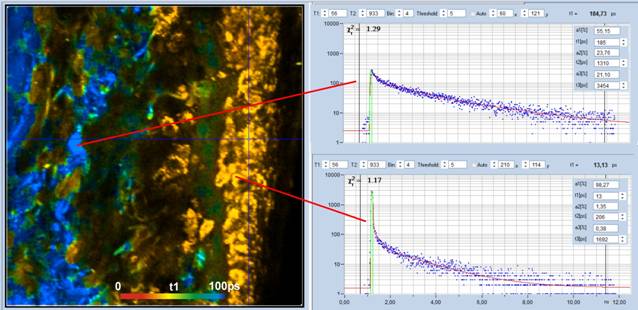
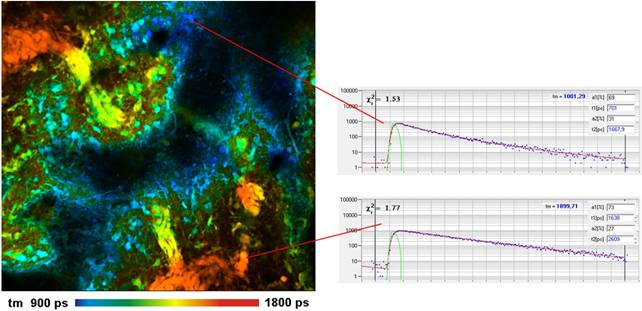
Ultra-Fast Fluorescence
Decay in Malignant Melanoma
Use ultra-fast
FLIM for melanoma detection. Below: Melanoma sample, decay curves of healthy
tissue and tumor tissue. The tumor has a fast decay component of 13 ps [20].
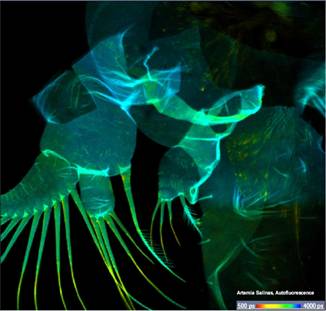
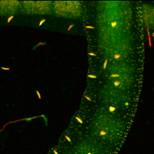
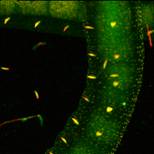
Autofluorescence
Imaging of Small Organisms
Study environment effects on small
organisms by recording autofluorescence. Benefit from the fact that FLIM
parameters are sensitive to the metabolic state.
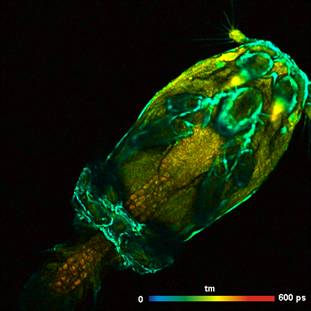
High-Resolution Z Stacks
Resolve fluorescence dynamics through the entire
depth of small organisms. Benefit from high spatial and temporal resolution. Please
see [21] for details.
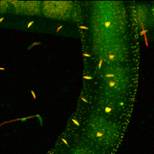
Express FLIM: Video
Sequences from Dynamic Objects
Record video sequences from dynamically
changing objects. Below: FLIM sequence from Enchytraeus albidus, 5 frames per
second.
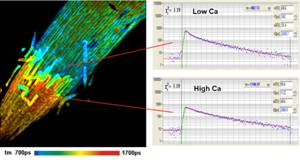
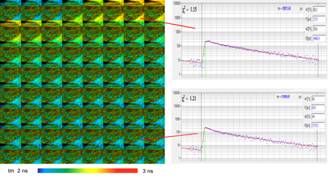
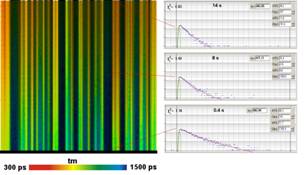
Triggered Accumulation of Time Series - Recording of Fast Physiological
Effects
Record FLIM
data of fast physiological effects as fast as the scanner can run [2, 22].
Below, left: Calcium transient in cultured neurons, temporal mosaic imaging, 40 ms
per image. Right: Chlorophyll transient, line scanning, 0.5 s per line.
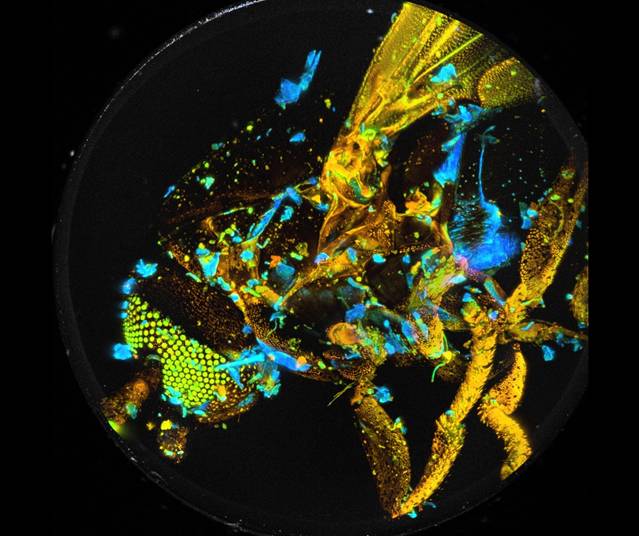
Temporal Mosaic FLIM: Precision Lifetime Analysis of
Moving Objects
Record precision decay data from moving objects. Below: Metabolic
FLIM on the moving leg of a water flee. bh Temporal Mosaic FLIM with subsequent
image segmentation [2, 24]. Precision decay curve shown lower
right.
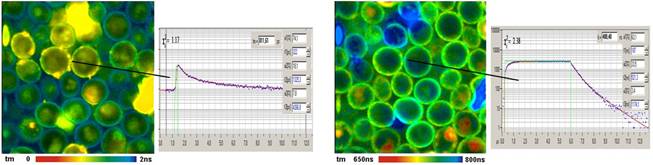
Simultaneous FLIM / PLIM
bh FLIM systems are able to record fluorescence and
phosphorescence simultaneously. Use simultaneous FLIM and PLIM to record the
metabolic state of cells in dependence of the oxygen concentration [25, 26].
FLIM with NIR Dyes
NIR dyes often show large variation in
their fluorescence decay with the molecular environment [2]. Explore the use of
NIR fluorophores as molecular sensors! Below: Pig skin stained with DTTCC.
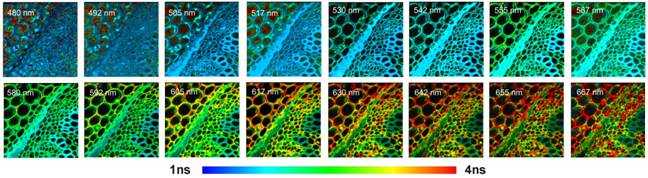
Multi-Wavelength Detection
Explore the unexplored: Simultaneous Detection
in 16 wavelength channels. Please see [1, 2] for details.
bh
Lifetime Imaging Systems
DCS-120 Confocal
Confocal scanning by bh DCS scanner, two ps
diode lasers, hybrid detectors, two parallel SPC-180 TCSPC / FLIM
channels. Controlled by SPCM software, data analysis by SPCImage NG. Expandable
with more lasers and detectors [3].
DCS-120 Multiphoton
Multiphoton scanning by bh DCS scanner, excitation
by Ti:Sa laser, non-descanned detection, hybrid detectors, two parallel SPC-180
TCSPC / FLIM channels. Controlled by SPCM software, data analysis by
SPCImage NG [3].
DCS-120 Multiphoton Fibre
Multiphoton scanning by bh DCS scanner, excitation
by femtosecond fibre laser, non-descanned detection, hybrid detectors, two parallel
SPC-180 TCSPC / FLIM channels. Controlled by SPCM software, data
analysis by SPCImage NG [3].
DCS-120 MACRO
Confocal scanning in the image plane of a bh
DCS scanner. No microscope needed. Image size up to 15 mm, resolution 15 µm.
Two ps diode lasers, two hybrid detectors, two parallel SPC-180 TCSPC / FLIM
channels. Controlled by SPCM software, data analysis by SPCImage NG [3].
FLIM System for Zeiss LSM 980 confocal
Confocal scanning, up to four bh ps diode
lasers, two hybrid detectors, two SPC‑180 TCSPC FLIM channels. Controlled
by Zeiss ZEN software and bh SPCM software. SPCM integrated in ZEN via TCP
interface. Data analysis by SPCImage NG [4, 5].
FLIM System for Zeiss LSM 980 NLO Multiphoton
Multiphoton scanning by Ti:Sa laser,
non-descanned detection, hybrid detectors, two SPC‑180 TCSPC FLIM
channels. Controlled by Zeiss ZEN software and bh SPCM software. SPCM
integrated in ZEN via TCP interface. Data analysis by SPCImage NG [4, 5].
FLIM System for Zeiss LSM 980 NLO Multiphoton with BIG
detector
Multiphoton scanning by Ti:Sa laser,
non-descanned detection by Zeiss BIG detector, recording by two channels of one
SPC-QC-104 TCSPC FLIM module. Controlled by Zeiss ZEN software and bh SPCM
software. SPCM integrated in ZEN via TCP interface. Data analysis by SPCImage
NG [4, 5].
FLIM System for Leica SP 5 / SP 8 multiphoton with Hyd
detectors
Multiphoton scanning by Ti:Sa laser, non
descanned detection by Leica Hyd detectors. Two SPC‑180 TCSPC FLIM
channels, data analysis by SPCImage NG [2, 6].
FLIM Systems for other laser scanning microscopes
Please see The bh TCSPC Handbook [1],
available on www.becker-hickl.com.
References
1.
W. Becker (ed.), Advanced time-correlated single
photon counting applications. Springer, Berlin, Heidelberg, New York (2015)
2. W. Becker, The bh TCSPC handbook, 10th edition. Becker & Hickl
GmbH (2023), available online on www.becker-hickl.com. Please contact bh for printed copies.
3. Becker & Hickl GmbH, DCS-120 Confocal and Multiphoton FLIM
Systems, user handbook, 9th ed. (2021). Available on www.becker-hickl.com
4. Becker & Hickl GmbH, Modular FLIM systems for Zeiss
LSM 710 / 780 / 880 family laser scanning microscopes. User handbook, 7th
ed. (2017). Available on www.becker-hickl.com
5. Becker & Hickl GmbH, FLIM Systems for Zeiss LSM 980 Laser
Scanning Microscopes. Addendum to: Handbook for modular FLIM systems for Zeiss
LSM 710 / 780 / 880 family laser scanning microscopes. Available on
www.becker-hickl.com
6. Becker & Hickl GmbH, Multiphoton FLIM with the Leica HyD RLD
Detectors. Application note, available on www.becker-hickl.com
7. W. Becker, V. Shcheslavskiy, A. Bergmann, FLIM at a Time-Channel
Width of 300 Femtoseconds. Application note, available on
www.becker-hickl.com
8. W. Becker, A Common Mistake in Lifetime-Based FRET Measurement. Application
note, available on www.becker-hickl.com
9. W. Becker, Double-Exponential FLIM-FRET Approach is Free of
Calibration. Application note, available on www.becker-hickl.com
10. W. Becker, A. Bergmann, Measurement of Membrane Potentials in Cells
by TCSPC FLIM. Application note, available on www.becker-hickl.com
11. Becker & Hickl GmbH, FLIM Systems for Laser Scanning
Microscopes. Overview brochure, available on www.becker-hickl.com
12. W. Becker, A. Bergmann, L. Braun, Metabolic Imaging with the DCS-120
Confocal FLIM System: Simultaneous FLIM of NAD(P)H and FAD, Application note,
available on www.becker-hickl.com
13. Becker Wolfgang, Suarez-Ibarrola Rodrigo, Miernik Arkadiusz, Braun
Lukas, Metabolic Imaging by Simultaneous FLIM of NAD(P)H and FAD. Current
Directions in Biomedical Engineering 5(1), 1-3 (2019)
14. W. Becker, L. Braun, DCS-120 FLIM System Detects FMN in Live Cells,
application note, available on www.becker-hickl.com
15. W. Becker, L. Braun, J. Heitz, V. Shcheslavskiy, M. Shirmanova,
Metabolic FLIM of Macroscopic Objects. Application note (2022), available on
www.becker-hickl.com
16. M. Lukina, K. Yashin, E. E. Kiseleva, A. Alekseeva, Varvara
Dudenkova, E. V. Zagaynova, E. Bederina, I. Medyanic, W. Becker, D. Mishra, M.
Berezin, V. I. Shcheslavskiy, M. Shirmanova, Label-Free Macroscopic
Fluorescence Lifetime Imaging of Brain Tumors. Frontiers in Oncology 11,
666059, 1-11 (2021)
17. W. Becker, C. Junghans, A. Bergmann, Two-Photon FLIM of Mushroom
Spores Reveals Ultra-Fast Decay Component. Application note (2021), available
on www.becker-hickl.com.
18. W. Becker, C. Junghans, V. Shcheslavskiy, High-Resolution
Multiphoton FLIM Reveals Ultra-Fast Fluorescence Decay in Human Hair.
Application note, www. becker-hickl.com (2023)
19. W. Becker, A. Bergmann, C. Junghans, Ultra-Fast Fluorescence Decay
in Natural Carotenoids. Application note, www. becker-hickl.com (2022)
20. W. Becker,V. Shcheslavskiy, V. Elagin, Ultra-Fast Fluorescence Decay
in Malignant Melanoma. Application note, available on www. becker-hickl.com
21. W. Becker, J. Heitz, L. Braun, A.l Bergmann, High Resolution Z-Stack
FLIM with the Becker & Hickl DCS‑120 Confocal FLIM System.
Application note, available on www. becker-hickl.com
22. W. Becker, V. Shcheslavkiy, S. Frere, I. Slutsky, Spatially Resolved
Recording of Transient Fluorescence-Lifetime Effects by Line-Scanning TCSPC.
Microsc. Res. Techn. 77, 216-224 (2014)
23. W. Becker, Bigger and Better Photons: The Road to Great FLIM
Results. Education brochure, available on www.becker-hickl.com.
24. Becker & Hickl GmbH, SPCImage next generation FLIM data
analysis software. Overview brochure, available on
www.becker-hickl.com
25. Wolfgang Becker, Stefan Smietana, Simultaneous Phosphorescence and
Fluorescence Lifetime Imaging by Multi-Dimensional TCSPC and Multi-Pulse
Excitation. Application note, available on www.becker-hickl.com
26. S. Kalinina, V. Shcheslavskiy, W. Becker, J. Breymayer, P. Schäfer,
A. Rück, Correlative NAD(P)H-FLIM and oxygen sensing-PLIM for metabolic
mapping. J. Biophotonics 9(8):800-811 (2016)
Becker & Hickl GmbH
Nunsdorfer Ring 7-9
12277 Berlin, Germany
Tel. +49 30 212 800 20
email: info@becker-hickl.com
https//www.becker-hickl.com