High-Resolution
Measurement of NADH and FAD Fluorescence Decay
with the DCS-120 MP
Wolfgang Becker, Lukas Braun, Axel Bergmann
Becker & Hickl GmbH, Berlin, Germany
Abstract: The bh DCS-120 MP system is able to record
single decay functions at extremely high precision and time resolution. We used
the system to record decay functions of NADH and FAD with an IRF width of
19 ps. Fluorescence decay functions were obtained for NADH and FAD in
aqueous solution, and in a diluted solution of citric acid at pH = 4.
The decay curves are multi-exponential, with decay components as fast as
115 ps for NADH and 59 ps for FAD. The curves measured at pH = 7
and pH = 4 are significantly different, and they are different from decay
curves recorded in cells. The procedures described can be used to supplement
FLIM experiments with precision decay parameters of the fluorophores involved.
Similar measurement can be performed with other bh FLIM systems, especially if
these are equipped with bh's ultra-fast HPM-100-06 detectors.
Precision Recording of Decay Functions with bh FLIM
Systems
FLIM experiments give direct insight into
molecular processes in live cells and tissues [1, 2]. The experiments often have to be supplemented
by precision measurements of the decay functions of the fluorophores involved.
FLIM users then usually resort to an additional fluorescence lifetime
spectrometer for cuvette-based measurements of decay functions. In many cases,
however, such fluorescence decay data can be favourably be recorded with the
FLIM system itself [2, 5]. Recording the decay functions with the FLIM system has several
advantages. The obvious one is that the data are recorded under exactly the
same conditions as with the FLIM system. The excitation and detection
wavelengths are the same, the system IRF is the same, and the geometric
configuration is the same. The influence of the anisotropy decay cancels by the
high NA of the objective lens, transit time-effects in a cuvette are avoided,
and reabsorption effects are negligible due to the small size of the
observation volume [2]. Most
importantly, however, measurements with bh's FLIM systems provide superior time
resolution. With femtosecond lasers and bh's HPM-100-06 detectors an IRF width
of <20 ps FWHM is obtained [4], see Fig. 1, left. Even for diode-laser
excitation the IRF width stays below 50 ps FWHM [7], see see Fig. 1, right.
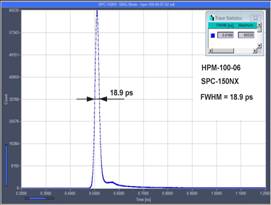
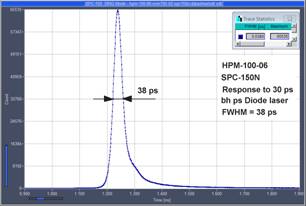
Fig. 1: Left:
IRF with femtosecond laser. Right: IRF with bh BDS-405nm diode laser
For the experiments described below we used
a DCS-120 MP multiphoton system with a Toptica 785 nm Femto Fibre Pro
femtosecond laser, non-descanned detection, and HPM-100-06 hybrid detectors [5].
The IRF width of this system is about 19 ps, FWHM. The DCS scan head was attached
to a NIKON TE 2000 inverted microscope.
The dye solution to be investigated was put
in a cell dish, placed under the microscope and scanned the same way as a
normal cell or tissue sample. The laser power was adjusted to obtain a count
rate of about 106 photons per second. The entire 'image' was sent to
the SPCImage NG data analysis software [2, 5] and [6]. Data of a large ROI or of the
entire image were combined by the 'lock' function of SPCImage. The resulting
decay curve contains several million photons and can thus be precisely analysed
by fitting with double- or triple-exponential decay models.
NADH and FAD Decay Curves
NADH decay curves are shown in Fig. 2 and Fig.
3. Fig. 2 is in pure water, Fig. 3 is in dilute citric acid, pH = 4.
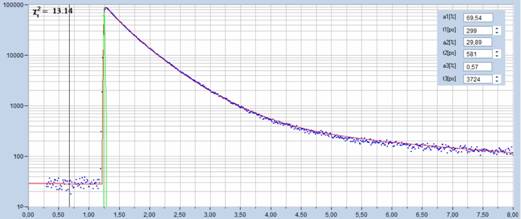
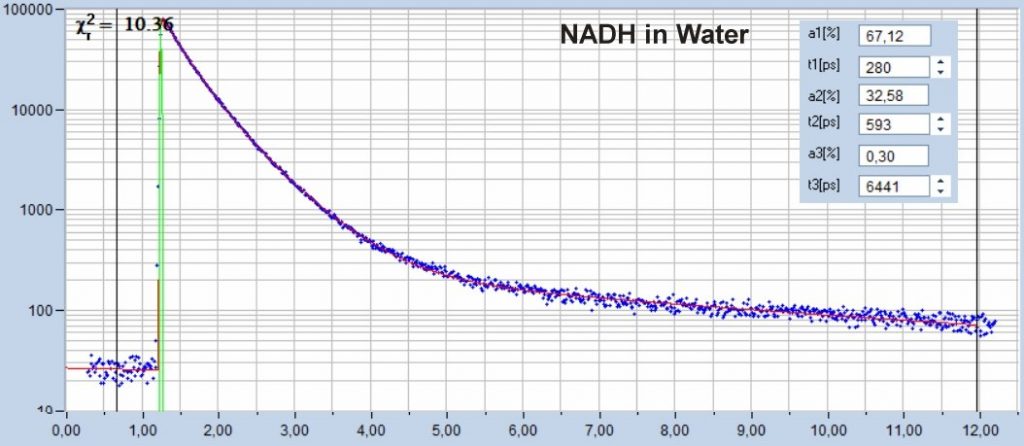
Fig. 2: NADH
dissolved in pure water. Lifetimes and amplitudes of decay components shown
upper right.
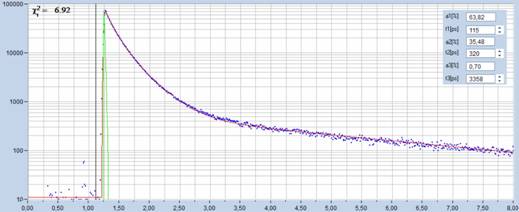
Fig. 3: NADH
in water with citric acid, pH = 4. Lifetimes and amplitudes of decay
components shown upper right.
Already at first glance, it can be seen
that the decay functions are multi-exponential. That means NAD(P)H exist in
different conformations or modifications. The decay times and the amplitudes of
the components are shown in the inserts in the upper right of the figures. The
fastest components are 299 ps and 115 ps. This is shorter than
normally found in cells. Nevertheless, short components sometimes show up also
in cells. The results show that these components may indeed by real.
A comparison of Fig. 2 and Fig. 3 further
shows that there is a significant change in the decay parameters with the
molecular environment. It is possible that the change is mostly induced by the
change in pH, which would be in agreement with [12]. However, it is possible
that also the redox potential of the molecular environment of the NADH
molecules has an influence. It is known that it has a dramatic influence on the
fluorescence intensity of NADH and FAD [9], and it may have an influence on the
lifetimes as well.
Fig. 4 and Fig. 5 show similar decay curves
for FAD. Fig. 4 was recorded in purely aqueous solution, Fig. 5 in diluted
citric acid, with pH = 4. Interestingly, the data recorded in pure
water show an extremely fast decay component of 59 ps. It is present with
an amplitude of about 30%. The existence of a fast components has already been reported
in [8], where it was extracted from the data by multi-exponential fit
procedures. Fig. 4 shows it directly, for the first time, indicating that the
component is real. The decay data recorded with citric acid (Fig. 5) do not
show the fast component. Moreover, the decay function at pH = 4
is visually undistinguishable from a single-exponential decay. (A
single-exponential fit delivers t = 3.1 ns.) Also here, we
cannot tell whether the change in the decay curve is induced by a change in pH
or by a change in the redox potential.
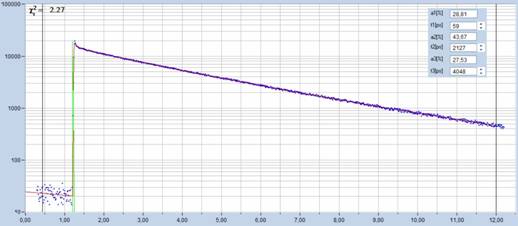
Fig. 4: FAD in
water. Lifetimes and amplitudes of decay components shown upper right.
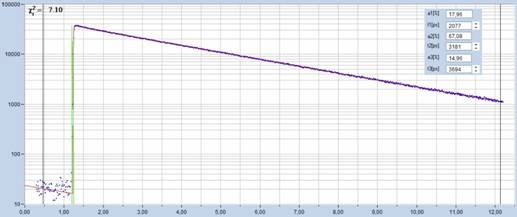
Fig. 5: FAD in water with citric acid, pH = 4. Lifetimes and amplitudes of
decay components shown upper right.
Comparison with Decay Curves in Cells
Fig. 6 and Fig. 7 are showing NADH and FAD decay functions measured
in cells. The curves were extracted from FLIM images of excised human
epithelial bladder tissue. Excitation for NADH and FAD was performed quasi-simultaneously
by ps diode lasers of 375 nm and 410 nm. Details of the experiments
are described in [3]. The decay curves are totally different from the curves
obtained in solution. In particular, there are no traces of the ultra-fast
decay components. However, the difference in the decay profiles is not
surprising. In solution the decay components originate from intrinsically
different modifications or conformations of NADH and FAD. In cells, the decay
functions are dominated by the lifetimes of bound and unbound NAD(P)H and bound
an unbound FAD [2, 10, 11]. It should also be noted that there may be
additional fluorophores present in the cells. The FAD signals from cells usually
contain a small amount of fluorescence of FMN. The lifetime of the FMN
fluorescence is 4 ... 5 ns. The slow decay component in Fig. 7 may
therefore originate from FMN.
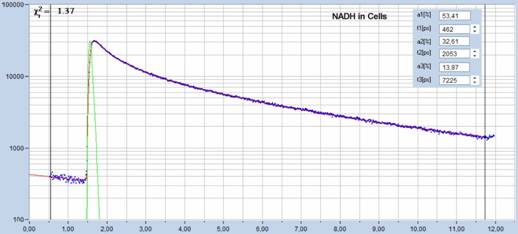
Fig. 6: NADH
decay function in cells
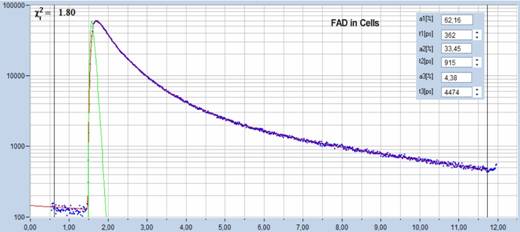
Fig. 7: FAD
decay function in cells
Summary
The bh DCS-120 MP system is able to record single fluorescence decay
curves at extraordinarily high time resolution. Here, we have demonstrated the
use of the system for recording precision decay functions of NADH and FAD in
solution. The data show fast decay components on the order of 115 ps for
NADH and 59 ps for FAD. The presence of a fast FAD component has been suspected
earlier, but the DCS-120 MP measurement shows it directly for the first
time. Similar measurements can be performed with other bh FLIM systems,
especially if these are equipped with the ultra-fast HPM-100-06 hybrid
detectors.
References
1.
W. Becker (ed.) Advanced time-correlated single
photon counting applications. Springer, Berlin, Heidelberg, New York (2015)
2.
W. Becker, The bh TCSPC Handbook. 8th edition
(2019). Available on www.becker-hickl.com. Please contact bh for printed
copies.
3.
W. Becker, A. Bergmann, L. Braun, Metabolic
Imaging with the DCS-120 Confocal FLIM System: Simultaneous FLIM of NAD(P)H and
FAD, Application note, available on www.becker-hickl.com (2018)
4.
Becker & Hickl GmbH, Sub-20ps IRF Width from
Hybrid Detectors and MCP-PMTs. Application note, available on
www.becker-hickl.com
5.
Becker & Hickl GmbH, DCS-120 Confocal and
Multiphoton FLIM Systems, user handbook, 8th edition (2019).
www.becker-hickl.com. Please
contact bh for printed copies.
6.
Becker & Hickl GmbH, SPCImage NG FLIM Data
Analysis Software. Overview brochure, available on www.bercker-hickl.com
7.
Becker & Hickl GmbH, HPM-100-06/07, Ultra-High
Speed Hybrid Detectors for TCSPC. Data sheet, available on www.becker-hickl.com
8.
P.A.W. van den Berg, K.A.Feenstra, A.E. Mark,
H.J.C.Berendsen, A.J.W.G. Visser, Dynamic Conformations of Flavin Adenine
Dicucleotide: Simulated molecular dynamics of the flavin cofactor related to
the time-resolved fluorescence characteristics. J. Phys. Chem. 106, 8858-8869
(2002)
9.
B. Chance, B. Schoener, R. Oshino, F. Itshak, Y.
Nakase, Oxidationreduction ratio studies of mitochondria in freeze-trapped
samples. NADH and flavoprotein fluorescence signals J. Biol. Chem. 254,
47644771 (1979)
10.
J.R. Lakowicz, H. Szmacinski, K. Nowaczyk, M.L.
Johnson, Fluorescence lifetime imaging of free and protein-bound NADH, PNAS 89,
1271-1275 (1992)
11.
J.R. Lakowicz, Principles of Fluorescence
Spectroscopy, 3rd edn., Springer (2006)
12.
P.M. Schaefer, D. Hilpert, M. Niederschweiberer,
L. Neuhauser, S. Kalinina, E. Calzia, A. Rueck, B. von Einem, C.A.F. von Arnim,
Mitochondrial matrix pH as a decisive factor in neurometabolic imaging. Neurophotonics
4(4):045004 (2017)
Contact:
Wolfgang Becker
Becker & Hickl GmbH
Berlin, Germany
Email: becker@becker-hickl.com
info@becker-hickl.com