Metabolic FLIM of
Macroscopic Objects
Wolfgang Becker, Lukas Braun, Julius Heitz, Becker &
Hickl GmbH, Berlin
Vladislav
Shcheslavskiy, Marina Shirmanova, Privolzhski Research Medical University, Nizhniy
Novgorod
Abstract: Fluorescence lifetime images of macroscopic
samples as large as 20 mm can be recorded in the primary focal plane of
the DCS‑120 confocal scanner. The system can be used for measuring metabolic
parameters of biological tissue. Metabolic FLIM is performed via the
fluorescence decay parameters of NAD(P)H and thus requires an excitation
wavelength of 375 nm or shorter. Commonly used lens elements have poor
transmission and large chromatic aberration at this wavelength. We therefore
replaced the standard scan lens with one that consists of a combination of UV
achromats. This increases the efficiency of the system by 40%. The spatial
resolution is about 15 µm, images can be recorded with pixel numbers as
large as 2048 x 2048. Acquisition times range from a few seconds for
imaging with low pixel number and moderate lifetime accuracy to a few minutes
for mega-pixel images and ultra-high accuracy of the decay data. We demonstrate
the use of the system for metabolic imaging of a tumor in a mouse and of
glioblastoma in a rat brain.
Motivation
FLIM, especially TCSPC FLIM, is usually
associated with imaging through a laser scanning microscope [2, 3]. A laser
beam is sent down the beam path of the microscope, and scanned around a pivot
point located in the principle plane of the microscope lens. The fluorescence
light is collected back through the microscope lens and the scanner, separated
from the excitation light by a dichroic mirror, and detected through a pinhole [3, 4]. Microscopes are usually limited to an
image size of no more than 500 x 500 µm. To perform FLIM of
larger objects bh have introduced the DCS-120 MACRO system [3, 4]. Instead of imaging
through a microscope, this system scans the object directly in the image plane
of the scanner. An example is shown in Fig. 1.
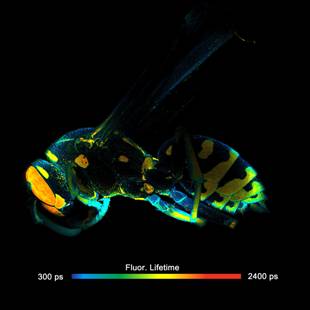
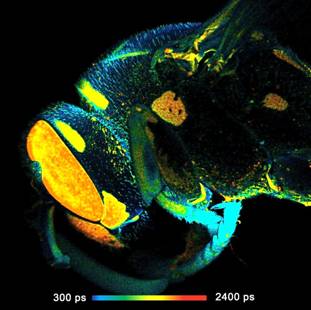
Fig. 1: FLIM of a wasp recorded in the primary image plane of a bh DCS-120
scanner. 2048x2048 pixels, 256 time channels. Left: Full-size scan, field
diameter 18 mm. Right: A digital zoom into the image shown left gives an
impression of the spatial resolution on the data.
Principle
The optical principle of the DCS-MACRO system is shown in Fig. 2. The
angle of the laser beam is scanned by two fast-moving galvanometer mirrors. The
scan lens focuses the laser beam into an image plane shortly in front of the
scanner, and simultaneously transfers the angular motion of the beam into a
lateral motion in this plane [4].
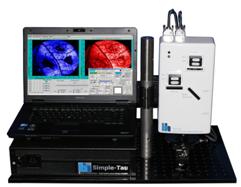
Fig. 2: Left:
Principle of the DCS-120 scanner for imaging macroscopic objects. Right: Photo
of the system.
The focused laser beam excites fluorescence
at the surface of the sample or slightly below. The fluorescence light is collected
and collimated by the scan lens, de-scanned by the galvanometer mirrors, and separated
from the excitation light by the main dichroic beamsplitter. The fluorescence
beam is further split into two spectral or polarisation components, and focused
into pinholes. Only light that comes from the focal plane of the excitation
beam can pass the pinholes efficiently. The pinholes thus suppress light that
is scattered in the sample or excited outside the focal plane. Photons passing
the pinholes is sent to the detectors [5, 6] through bandpass filters. FLIM data
are built up from the times and locations of the photons by multi-dimensional
TCSPC [2, 3].
In fact, Fig. 2 describes the known
operation principle of a confocal scanner [3, 4]. It is the same as for a scanner
attached to a microscope, with the difference that the microscope and thus the magnification
by its objective lens is left off. The relative resolution of the images, i.e.
the ratio of field diameter to the size of the point-spread function is the
same as in combination with a microscope. A full-size images can, in principle,
reasonably be scanned with 2048 x 2048 pixels. That means, images
recorded in the scanner image plane can be amazingly rich in detail, as can be
seen in Fig. 1. Acquisition
times range from a few seconds for imaging with low pixel number and moderate
lifetime accuracy to a few minutes for mega-pixel images and ultra-high
accuracy of the decay data.
Metabolic FLIM
Metabolic imaging by TCSPC FLIM has an
enormous potential for cancer detection [18, 30], investigation of cancer
origins and cancer progression [17, 19, 23,], and evaluation of the response of
cells and tissues to anti-cancer drugs [16, 22, 24, 29].
Metabolic imaging is performed best by FLIM
of NAD(P)H (nicotinamide adenine (pyridine) dinucleotide). It is known that the
fluorescence decay function of NAD(P)H depends on the binding to proteins [12, 13, 20]. Unbound NAD(P)H has a fluorescence
lifetime of about 0.3 to 0.5 ns, bound NAD(P)H has a lifetime of
1.2 ns to 3.5 ns [13].
The ratio of the amounts of bound and unbound NAD(P)H depends on the type of
the metabolism. A cell can run both a reductive metabolism (glycolysis) and an
oxidative one (oxidative phosphorylation). A shift from glycolysis to oxidative
phosphorylation or back results in a change in the unbound/bound ratio. Thus,
the bound/unbound ratios reflect the Warburg Effect: In normal cells oxidative phosphorylation dominates, in cancer
cells reductive glycolysis [31, 32].
Spectral separation of the signals from
bound and unbound NAD(P)H is difficult, if not impossible. In FLIM data, however,
the signals can be separated by double-exponential decay analysis [3, 7]. The amplitude of the fast component, a1
('metabolic indicator'), or the ratio of the amplitudes of the decay
components, a1/a2, (metabolic ratio), directly represent the concentration
ratio of unbound/bound NAD(P)H and thus characterises the metabolic state of
the tissue [3, 9, 10, 21, 27]. Having a large field of view can be extremely
useful in these applications. The cell metabolism in a large piece of tissue
stays intact for a longer period of time than in a thin tissue slice, post-surgery
material can better be inspected for completeness of tumor excision, tumors can
be investigated in their natural environment, and the effect of a tumor on the
surrounding tissue can be studied.
UV Operation of the Scanner
A problem of NAD(P)H FLIM is the short
excitation wavelength. For efficient excitation a wavelength in the range from
340 nm to 375 nm is required. Optics made of the traditional crown and
flint glasses or of the modern replacements of them have poor transmission in
this wavelength range. This is not a severe problem when the scanner is used in
combination with a microscope. The laser power is then limited by the
photostability of the sample. The applicable power is far below the maximum
power of a picosecond diode laser, so that some loss in the excitation path can
easily be tolerated.
For a macro scanner the situation is
different. The numerical aperture of the detection beam path is much smaller
than in a microscope. That means the collection efficiency is lower. Low
detection efficiency must be compensated by high excitation power. Different
than in a microscope, high power it not a problem for the sample because it is
distributed over a large scan area. Unfortunately, the power of a picosecond
diode laser is limited to a few mW. It is therefore important to minimise the
losses of the laser on its way from the scanner input to the sample. We
therefore designed a scan lens from novel UV-transparent glass types which
recently became available. A comparison of the image intensity obtained with new
UV scan lens compared to the normal VIS lens is given in Fig. 3. A FLIM image
recorded with the UV lens is shown left, an image recorded with the VIS lens is
shown right. The recorded intensity is 40% higher with the UV lens.
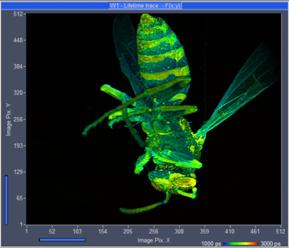
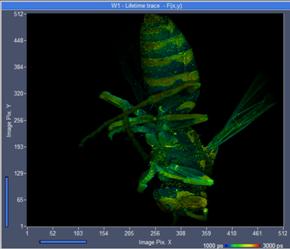
Fig. 3: FLIM of
a wasp, excitation 375 nm. Recorded with the UV lens (left) and image recorded
with the VIS lens (right)
Results
Tumor in a Mouse
Fig. 4 shows a FLIM image of a tumor in a
mouse. The skin was removed over the tumor to provide direct optical access to
the tumor tissue. The data were analysed with SPCImage NG [3, 7]. A
double-exponential model was used, the image parameter is the amplitude, a1, of
the fast decay component.
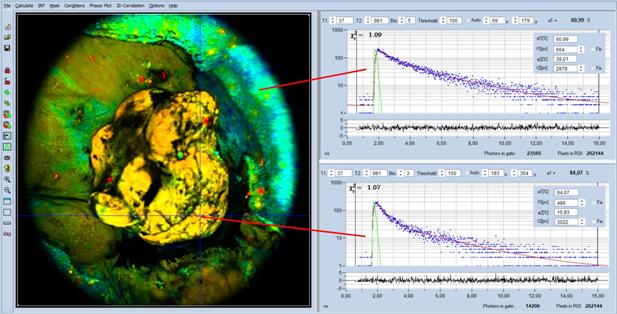
Fig. 4: Macro-FLIM data of an open tumor in a mouse. Analysis with
SPCImage, double-exponential analysis, image parameter is the amplitude, a1, of
the fast decay component. Decay curves in the non-tumor and in the tumor region
shown on the right.
Decay curves in the non-tumor and in the
tumor region are shown on the right. Visibly, the decay curve in the tumor
region (lower curve) appears steeper than the curve in the non-tumor region
(upper curve). The decay parameters (see insert in the curve) show the effect
quantitatively: The amplitude, a1, in the tumor region is higher than in the
non-tumor region. The a1 values are 84% and 61%, respectively. This is exactly
what has to be expected: The amount of free NAD(P)H is higher in the tumor [3].
The result is perfectly compatible with [10] and [27], where the transition
from non-tumor to tumor was found at an a1 of about 70%.
Glioblastoma
Almost all types of tumor cells and tumor
tissues investigated so far show identical behaviour: A tumor has an increase
in a1, showing that there is more unbound NAD(P)H than in healthy tissue [3]. No
so glioblastoma. Either there is no increase in a1 compared to the surrounding
brain tissue, or, in contrast to other tumors, even a decrease in a1. The
reasons of this behaviour are unknown. Of course, one may just accept that
glioblastoma are in some way special. However, it is hard to believe that
glioblastoma should have no metabolic shift toward glycolysis, or that this
shift should not be reflected by an increase of unbound NAD(P)H. We therefore
performed macroscopic FLIM measurement on excised rat brains that contained
glioblastoma, see [18] for details. An example is shown in Fig. 5.
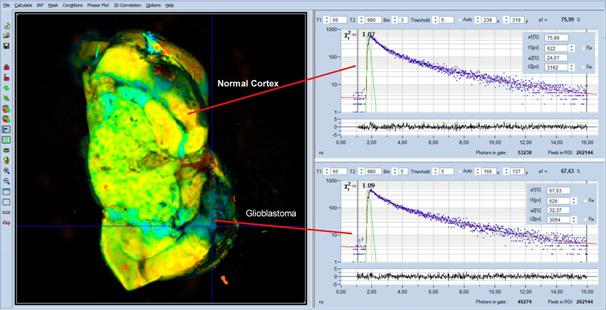
Fig. 5: MACRO-FLIM image of a rat brain with a glioblastoma. The glioblastoma
is the blue area in the lower right of the image. Decay curves from a healthy
region and from the tumor region are shown upper and lower right.
The glioblastoma is the blue area in the
lower right of the image. Decay curves from a healthy region and from the tumor
region are shown upper and lower right. Decay parameters are shown as inserts
in the decay curves. Indeed, the tumor has a lower a1 than the healthy tissue:
In the tumor a1 is 67%, compared to 76% in the surrounding brain tissue.
We can exclude simple instrumental
artefacts or mistakes in the measurement procedure as a source of the effect.
The data quality is excellent, as the decay curves in Fig. 5 show. A common
mistake is detection of FAD instead of NAD(P)H. FAD can be excited at the same
wavelength as NAD(P)H, and exhibits an opposite metabolic effect in a1 as
NAD(P)H. However, we used an emission filter which blocked wavelengths above 475 nm.
Accidental detection of FAD can therefore be excluded.
A hint towards a possible explanation is
the large a1 which is observed in the healthy regions. With a1 = 76%
it is in fact far in the region which is typical for tumors. Is the high a1 a
general feature of brain tissue? Is it possible that in fact a1 in the normal
regions is too high, and not the a1 in the tumor too low? This could
potentially reverse the a1 effect.
A possible reason of high a1 could be the
high metabolic activity of the brain cortex. The high energetic and
biosynthetic demands of neurons and astrocytes in the brain tissue shift its
metabolism toward glycolysis, accompanied by an increase in a1. Unlike the cortex,
the white matter, which is composed of myelinated nerve fibres, typically has
lower a1 than glioma, please see [33]. It can also not be excluded that the
excised brain tissue runs into hypoxia. It would then shift its metabolism
toward glycolysis, accompanied by an increase in a1. The only way to avoid this
is to drastically reduce the time from excising the brain to the FLIM
recording, or to record FLIM directly in the rat, either through a cranial
window [1] or through an optical fibre [15].
Possible Extensions
The system can be extended to detect FAD
simultaneously with NAD(P)H. Two lasers, one for excitation of NAD(P)H and the
other for FAD are multiplexed synchronously with the lines or frames of the
scan, and the emission signals detected by two detectors and two parallel TCSPC
FLIM channels [9]. The corresponding control functions are implemented in the
scan controller and in the SPCM data acquisition software [3, 4].
Laser multiplexing can also be used to
record NAD(P)H FLIM simultaneously with FLIM of an exogenous fluorophore. This
fluorophore may be used to detect changes in pH [26], concentration of special
ions, protein conformation, local viscosity, or another molecular parameter [28].
Another extension is simultaneous recording
of FLIM and PLIM (phosphorescence lifetime images) [8]. FLIM is then used to determine the
metabolic state, PLIM to determine the oxygen partial pressure in the tissue [11,
25]. Also these functions are implemented in the DCS-MACRO standard systems.
Please see [3, 4].
Summary
The bh DCS-120 MACRO system detects FLIM
from objects as large as 20 mm in diameter. The sensitivity of the system
at excitation wavelengths in the near-UV region has been significantly
increased by a new scan lens consisting of novel UV transmitting glass types. A
375-nm picosecond diode laser is used to excite fluorescence of NAD(P)H. The
fluorescence is detected by high-speed high sensitivity hybrid detectors and
recorded by multi-dimensional TCSPC. The spatial resolution of the images is
about 15 µm, pixel numbers can be as large as 2048 x 2048. We
have shown the performance of the system for recording metabolic FLIM of a
tumor in a mouse and of glioblastoma in a rat brain. The data are analysed with
SPCImage NG. Double exponential decay analysis delivers the amplitude of the
fast decay component, a1, which is a direct indicator of the metabolic state of
the tissue.
References
1.
B. J. Bacskai, J. Skoch, G.A. Hickey, O.
Berezovska, B.T. Hyman, Multiphoton imaging in mouse models of Alzheimers
disease, Proc. SPIE, 5323, 71-76 (2004)
2. W. Becker, Advanced time-correlated single-photon counting techniques. Springer,
Berlin, Heidelberg, New York, 2005
3.
W. Becker, The bh TCSPC handbook. 9th edition,
Becker & Hickl GmbH (2021), available on www.becker-hickl.com. Please contact bh for printed
copies.
4. Becker & Hickl GmbH, DCS-120 Confocal Scanning FLIM Systems. User
handbook. www.becker-hickl.com
5. Becker & Hickl GmbH, The HPM‑100-40 Hybrid Detector.
Application note, available on www.becker-hickl.com
6. Becker & Hickl GmbH, Sub-20ps IRF Width from Hybrid Detectors
and MCP-PMTs. Application note, available on www.becker-hickl.com
7.
Becker & Hickl GmbH, SPCImage next
generation FLIM data analysis software. Overview
brochure, available on www.becker-hickl.com
8. Becker & Hickl GmbH, Simultaneous Phosphorescence and
Fluorescence Lifetime Imaging by Multi-Dimensional TCSPC and Multi-Pulse
Excitation. Application note, available on www.becker-hickl.com
9. W. Becker, A. Bergmann, L. Braun, Metabolic Imaging with the DCS-120
Confocal FLIM System: Simultaneous FLIM of NAD(P)H and FAD, Application note,
available on www.becker-hickl.com (2018)
10. W. Becker, R. Suarez-Ibarrola, A. Miernik, L. Braun, Metabolic
Imaging by Simultaneous FLIM of NAD(P)H and FAD. Current Directions in
Biomedical Engineering 5(1), 1-3 (2019)
11. S. Kalinina, V. Shcheslavskiy, W. Becker, J. Breymayer, P. Schäfer,
A. Rück, Correlative NAD(P)H-FLIM and oxygen sensing-PLIM for metabolic
mapping. J. Biophotonics 9(8):800-811 (2016)
12. J.R. Lakowicz, H. Szmacinski, K. Nowaczyk, M.L. Johnson,
Fluorescence lifetime imaging of free and protein-bound NADH, PNAS 89,
1271-1275 (1992)
13. J.R. Lakowicz, Principles of Fluorescence Spectroscopy, 3rd edn.,
Springer (2006)
14. M.N. Pastore, H. Studier, C.S. Bonder, M.S. Roberts, Non-invasive
metabolic imaging of melanoma progression. Exp. Dermatol. 26, 607614 (2017)
15. M. Lukina, A. Orlova, M. Shirmanova, D.
Shirokov, A. Pavlikov, A. Neubauer, H. Studier, W. Becker, E. Zagaynova, T.
Yoshihara, S. Tobita, V. Shcheslavskiy, Interrogation of metabolic and oxygen
states of tumors with fiber-based luminescence lifetime spectroscopy. Optics Letters 42(4)
731-734 (2017)
16. M. M. Lukina, V. V. Dudenkova, N. I. Ignatovaa, I. N. Druzhkova, L.
E. Shimolina, E. V. Zagaynovaa, M. V. Shirmanova, Metabolic cofactors NAD(P)H
and FAD as potential indicators of cancer cell response to chemotherapy with
paclitaxel. BBA General Subjects 1862, 1693-1700 (2018)
17. M. M. Lukina, L. E. Shimolina, N. M. Kiselev, V. E. Zagainov, D. V.
Komarov, E. V. Zagaynova, M. V. Shirmanova, Interrogation of tumor metabolism
in tissue samples ex vivo using fluorescence lifetime imaging of NAD(P)H.
Methods Appl. Fluoresc. 8, 014002, 1-11 (2020)
18. M. Lukina, K. Yashin, E. E. Kiseleva, A. Alekseeva, Varvara
Dudenkova, E. V. Zagaynova, E. Bederina, I. Medyanic, W. Becker, D. Mishra, M.
Berezin, V. I. Shcheslavskiy, M. Shirmanova, Label-Free Macroscopic
Fluorescence Lifetime Imaging of Brain Tumors. Frontiers in Oncology 11,
666059, 1-11 (2021)
19. M.N. Pastore, H. Studier, C.S. Bonder, M.S. Roberts, Non-invasive
metabolic imaging of melanoma progression. Exp. Dermatol. 26, 607614 (2017)
20. R.J. Paul, H. Schneckenburger, Oxygen concentration and the
oxidation-reduction state of yeast: Determination of free/bound NADH and
flavins by time-resolved spectroscopy, Naturwissenschaften 83, 32-35 (1996)
21. P. M. Schaefer, S. Kalinina, A. Rueck, C.A.F. von Arnim, B. von
Einem, NADH Autofluorescence - A Marker on its Way to Boost Bioenergetic
Research. Cytometry Part A, 1-13 (2018)
22. A.T. Shah, K.E. Diggins, A.J. Walsh, J.M. Irish, M.C. Skala, In vivo
autofluorescence imaging of tumor heterogeneity in response to treatment.
Neoplasia 17, 862-870 (2015)
23. M. C. Skala, K. M. Riching, D. K. Bird, A. Dendron-Fitzpatrick, J.
Eickhoff, K. W. Eliceiri, P. J. Keely, N. Ramanujam, In vivo multiphoton
fluorescence lifetime imaging of protein-bound and free nicotinamide adenine
dinucleotide in normal and precancerous epithelia. J. Biomed. Opt. 12 02401-1
to 10 (2007)
24. A. A. Gillette, C. P. Babiarz, A. R. Van Dommelen, C. A. Pasch, L.
Clipson, K. A. Matkowskyj, D. A. Deming, M. C. Skala, Autofluorescence Imaging
of Treatment Response in Neuroendocrine Tumor Organoids. Cancers (Basel).
13(8), 1873, 1-17 (2021)
25. Y. P. Parshina, A. D. Komarova, L. N. Bochkarev, T. A. Kovylina, A.
A. Plekhanov, L. G. Klapshina, A. N. Konev, A. M. Mozherov, I. D. Shchechkin, M.
A. Sirotkina, V. I. Shcheslavskiy, M. V. Shirmanova, Simultaneous Probing of
Metabolism and Oxygenation of Tumors In Vivo Using FLIM of NAD(P)H and PLIM of
a New Polymeric Ir(III) Oxygen Sensor. Int. J. Mol. Sci. 23 (2022) 10263
26. P.M. Schaefer,
D. Hilpert, M. Niederschweiberer, L. Neuhauser, S. Kalinina, E. Calzia, A.
Rueck, B. von Einem, C.A.F. von Arnim, Mitochondrial matrix pH as a decisive
factor in neurometabolic imaging. Neurophotonics
4(4):045004 (2017)
27. R. Suarez-Ibarrola, L. Braun, P. Fabian Pohlmann, W. Becker, A.
Bergmann, C. Gratzke, A. Miernik, K. Wilhelm, Metabolic Imaging of Urothelial
Carcinoma by Simultaneous Autofluorescence Lifetime Imaging (FLIM) of NAD(P)H
and FAD. Clinical Genitourinary Cancer (2020)
28. K. Suhling, L. M. Hirvonen, J. A. Levitt, P.-H. Chung, C. Tregido,
A. le Marois, D. Rusakov, K. Zheng, Fluorescence Lifetime Imaging
(FLIM): Basic Concepts and Recent Applications. In: W. Becker (ed.)
Advanced time-correlated single photon counting applications. Springer, Berlin,
Heidelberg, New York (2015)
29. A. J. Walsh, R. S. Cook, M. E. Sanders, L. Aurisicchio, G.
Ciliberto, C. L. Arteaga, M. C. Skala, Quantitative Optical Imaging of Primary
Tumor Organoid Metabolism Predicts Drug Response in Breast Cancer. Cancer Res
74, OF1-OF11 (2014)
30. A. J. Walsh, A. T. Shah, J. T. Sharick, M. C. Skala, Fluorescence Lifetime
measurements of NADH in live cells and tissue. In: W. Becker (ed.) Advanced
time-correlated single photon counting applications. Springer, Berlin,
Heidelberg, New York (2015)
31. O. Warburg, On the origin of cancer cells. Science 123, 309-314
(1956)
32. O. Warburg, On respiratory impairment in cancer cells. Science 124,
269-270 (1956)
33. Yuzhakova D, Kiseleva E, Shirmanova M, Shcheslavskiy V, Sachkova D,
Snopova L, Bederina E, Lukina M, Dudenkova V, Yusubalieva G, Belovezhets T,
Matvienko D, Baklaushev V. Highly Invasive Fluorescent/Bioluminescent
Patient-Derived Orthotopic Model of Glioblastoma in Mice. Front Oncol. 2022 Jul
13;12:897839. doi: 10.3389/fonc.2022.897839.
