Metabolic Imaging
with the DCS-120 Confocal FLIM System: Simultaneous FLIM of NAD(P)H and FAD
Wolfgang Becker, Axel
Bergmann, Lukas Braun
Becker & Hickl GmbH, Berlin,
Germany
Abstract: We describe a metabolic imaging system based on
simultaneous recording of lifetime images of NAD(P)H and FAD. The system is
based on the bh DCS-120 confocal scanning FLIM system. It uses one-photon excitation
by ps diode lasers, scanning by galvanometer mirrors, confocal detection, and
two parallel TCSPC FLIM recording channels. The two lasers, with wavelengths of
375nm and 405 nm, are multiplexed to alternatingly excite NAD(P)H and FAD. One
FLIM channel detects in the emission band of NAD(P)H, the other in the emission
band of FAD. The FLIM data are processed by SPCImage data analysis software.
For both channels, the data analysis delivers images of the amplitude-weighted
lifetime, tm, the component lifetimes, t1 and t2, the amplitudes of the
components, a1 and a2, and the amplitude ratio, a1/a2. Moreover, it delivers
the fluorescence-lifetime redox ratio (FLIRR), a2nadh/a1fad.
We demonstrate the performance of the system at the example of human bladder
cells. Normal cells and tumor cells were discriminated by the tm images, the a1
images, and the FLIRR images.
Fluorescence Decay Functions of NAD(P)H and FAD
NAD(P)H (nicotinamide adenine (pyridine)
dinucleotide) and FAD (flavin adenine dinucleotide) are coencymes involved in
the cell metabolism. Both NAD(P)H and FAD are fluorescent. FAD and, especially,
NAD(P)H are unique in the sense that their fluorescence intensities and
fluorescence decay functions bear direct information on the metabolic state of
the cells.
It is known that the fluorescence lifetimes
of NAD(P)H and FAD depend on the binding to proteins [8, 9, 11]. Unbound NAD(P)H has a fluorescence lifetime of
about 0.3 to 0.4 ns. Bound NAD(P)H has a lifetime of about 1.2 ns [9]. However, the lifetimes may vary. We have found up
to 600 ps for the unbound component, and for the bound component lifetimes
up to 5 ns have been reported [9]. For FAD the effect of binding is opposite: Bound
FAD has a lifetime of a few 100 ps, unbound FAD of a few ns.
The ratios of the amounts of bound and
unbound NAD(P)H and of bound and unbound FAD depend on the type of the
metabolism. A cell can run both a reductive metabolism (glycolysis) and an
oxidative one (oxidative phosphorylation). A shift from glycolysis to oxidative
phosphorylation or back results in a change in the unbound/bound ratios. Thus,
the bound/unbound ratios reflect the Warburg Effect: In normal cells oxidative phosphorylation dominates, in cancer
cells reductive glycolysis [21, 22].
The a1/a2 Ratio
In intensity (or spectral) images the
fluorescence components from the bound and unbound states are almost
indistinguishable. In FLIM data they can easily be separated by
double-exponential decay analysis. The ratio on the amplitudes of the decay
components, a1/a2, often called amplitude ratio, directly represents the
concentration ratio of unbound/bound NADH or bound/unbound FAD, see Fig. 1.
A change in the in a1/a2 ratios therefore
indicates a change in the metabolism of a cell. A shift towards high a1/a2 in
the NAD(P)H decay (high unbound/bound ration) indicates a shift to glycolyis
and, possibly, to cancerous behaviour.
Fig. 1: Composition of the decay functions of NAD(P)H and FAD
A similar, yet less pronounced effect exists
for FAD. Normally, the lifetime (or a1/a2) variation is smaller than for
NAD(P)H. Therefore, a direct use of the FAD fluorescence for metabolic FLIM has
not been reported yet. FAD decay parameters are, however, being used to
supplement metabolic imaging by NAD(P)H.
Amplitude of the fast decay component, a1
The a1/a2 ratio directly represents the
unbound/bound an bound/unbound ratio of NAD(P)H and FAD, respectively. It's use
may appears attractive to describe the metabolic state. However, the a1/a2
has a disadvantage. Because a1 + a2 = 1 the a1/a2
ratio can also be expressed as
a1/a2 = a1
/ (1-a1)
That means, the a1/a2
ratio is a nonlinear function of a1. This is no problem as long as a1
remains in the range around 0.5 to 0.6. However, if a1 gets higher
than 0.8 (which is often the case for FAD) the function becomes highly
nonlinear. It is then hard to evaluate the pixel histograms. These get more and
more stretched toward larger a1/a2 values - please note
that a1 goes to infinity for a1=1. We therefore find it
more useful to base the evaluation of metabolic FLIM data on the amplitude
coefficient of the fast component, a1.
Amplitude-Weighted Lifetime
Often the amplitude-weighted lifetime,
tm = a1t1
+ a2t2
is used instead of the amplitude ratio or
the amplitude of the fast component. This approach delivers data of relatively
low noise but the results are only comparable as long as the component
lifetimes, t1 and t2, remain constant. This is not necessarily
the case, as has been shown by Schäfer et al. [12, 13]. In our own measurements we have found differences in
the component lifetimes in the range of almost 1:2 for different cells and tissues.
In other words, there is no fixed tm value that discriminates
between normal cells and tumor cells.
Redox Ratio
Both NAD(P)H and FAD form redox pairs.
NAD(P)H is fluorescent in its reduced form but loses fluorescence when oxidised
to NAD+. FAD is fluorescent when oxidised to FAD+, and
loses fluorescence when reduced. The fluorescence intensity ratio of FAD and NAD(P)H therefore
changes with the redox state of the tissue. Chance et al. [6, 7] defined a Redox Ratio which is
RR = IFAD / INAD(P)H ,
with IFAD and
INAD(P)H being the fluorescence intensities of FAD and NAD(P)H.
Please note that also the reciprocal definition is used, i.e. RR = INAD(P)H
/ IFAD .
Like the a1/a2 ratio
or the a1 amplitude, the redox ratio indicates whether the
metabolism in a cell is more oxidative (oxidative phosphorylation) or more
reductive (glycolysis). For practical applications please see [15, 16, 18, 20]. Unfortunately, measurements of the redox ratio
suffer from the same problems as all intensity-based methods: The result not
only depends on the redox state itself but also on the concentration ratio of
NAD(P)H and FAD. Moreover, instrumental imperfections, such as changes in the
laser power, focus drift, or image shift between the recording of the NAD(P)H
and the FAD data have an influence on the result. Also chromatic aberration of
the microscope lens can have an influence.
OMI Index
Skala and Walsh combined the normalised
value of the redox ratio RR, the normalised amplitude-weighted fluorescence
lifetime, tm NADH, and the normalised tm FAD, of NAD(P)H and FAD into a
single Optical Molecular Imaging, or OMI index. High OMI means a shift toward
glycolysis and cancer metabolism [19, 20].
Fluorescence-Lifetime Redox Ratio (FLIRR)
To navigate around the problems of the
classic redox ratio Alam et al. [1] and Wallrabe et al. [17] defined a fluorescence-lifetime redox ratio (FLIRR).
It is the ratio of the fractional amplitudes of the bound decay components of NAD(P)H,
a2/(a1+a2)NADH , and FAD, a1/(a1+a2)FAD.
a2/(a1+a2)NADH
FLIRR = --------------------
a1/(a1+a2)FAD
The advantage of the FLIRR is that it does
not depend on the relative amounts of NAD(P)H and FAD in the cells, and not on
the laser power, the focus accuracy or focus quality, or other instrument parameters.
Instrumental Considerations
Excitation and Detection Wavelengths
Approximate excitation and emission spectra
of NAD(P)H and FAD are shown in Fig.
2. The spectra were taken from [9] and
[14]. The figure shows that NAD(P)H needs an excitation
wavelength shorter than 380 nm. FAD can be excited all the way from
350 nm to about 475 nm.
The emission spectra show that a clean
NAD(P)H signal can be detected from about 425 to 475 nm. Above 475 nm
the NAD(P)H signal is overlaid by emission from FAD. FAD emission occurs from
about 480 nm to more than 600 nm. However, there is a strong overlap
from the NAD(P)H emission. A clean FAD signal can therefore only be detected if
an excitation wavelength above 400 nm is used, where excitation of NAD(P)H
is negligible. In other words, the signals from NAD(P)H and FAD can only be
separated if different excitation wavelengths and different detection wavelengths are used.
Fig. 2: Excitation and emission spectra of NADH and FAD. From bh TCSPC
Handbook, after [9] and [14].
As an additional instrumental condition,
the excitation wavelength for FAD should be outside the wavelength interval for
NAD(P)H detection. Taking into account the availability of laser diode
wavelengths there is only one possible combination:
NAD(P)H:
Excitation 375 nm,
Detection wavelength 420 to 470 nm
FAD: Excitation 405 nm, Detection
wavelength 490 to 600 nm
TCSPC FLIM Process with Laser Multiplexing
It is desirable that the data for NAD(P)H
and FAD are recorded quasi-simultaneously. This way, possible focus drift,
image shift, or, importantly, changes in the metabolic state of the cells
induced by the imaging process itself have the same influence on both
recordings. Quasi-simultaneous measurement at two excitation wavelengths can be
achieved by TCSPC FLIM in combination with laser multiplexing [2, 3, 4].
TCSPC FLIM is based on scanning the sample
by a high-repetition rate pulsed laser beam and the detection of single photons
of the fluorescence signal returning from the sample. Each photon is
characterised by its time in the laser pulse period and the coordinates of the
laser spot in the scanning area in the moment its detection. The recording
process builds up a photon distribution over these parameters. The result can
be interpreted as an array of pixels, each containing a full fluorescence decay
curve in a large number of time channels.
To record lifetime images excited by
several lasers of different wavelengths, the lasers are multiplexed in time. The
multiplexing period can be anywhere from a few microsecond to about one second.
To avoid aliasing with the scanning multiplexing is synchronised with the
pixels, lines, or frames of the scan. The number of the laser is used as an
additional coordinate of the photon distribution. The result can be interpreted
as a single photon distribution that has separate decay curves for the
individual lasers in their pixels, or as several photon distributions for the individual
lasers [2, 3, 4]. The principle is illustrated in Fig. 3.
Fig. 3: Principle
of TCSPC FLIM with laser wavelength multiplexing
Two such channels are operated in parallel,
detecting through different filters [5]. The result are lifetime images for four
combinations of excitation and detection wavelengths:
Excitation Emission Signal detected
Image 1 375 nm 420
to 470 nm NAD(P)H
Image 2 405 nm 420
to 470 nm NAD(P)H + FAD
Image 3 375 nm 490 to
600 nm FAD + NAD(P)H
Image
4 405 nm 490 to 600 nm FAD
The data of interest are the ones in
Image 1 (NAD(P)H) and in Image 4 (FAD).
Laser Multiplexing Control
Multiplexing of the lasers is
controlled via the GVD-120 scan controller of the DCS-120 system. The lasers
can be multiplexed frame by frame, line by line, or within each pixel (The last
option is also used for PLIM excitation). For user interface, parameter setup, and
other technical details please see Handbook of the DCS-120 system [5].
Data Analysis
Data analysis was performed by bh
SPCImage software, version 7.5. The data were loaded into SPCImage directly
from SPCM data acquisition software. SPCM was configured to display only the
two excitation - emission combinations of interest [4]. The data were sent to SPCImage by the 'Send to
SPCImage' command, with option 'All Windows'. The data showing up in SPCImage
were analysed by a double-exponential decay model. False-colour tm and a1
images were created by using 'colour' 'tm' and 'colour' 'a1%', respectively.
FLIRR images were created by switching to the NADH channel and using 'colour',
a1% divided by a2% of the FAD channel.
Results
Representative results are shown in Fig. 5 through Fig.
7. The images were obtained from human bladder cells
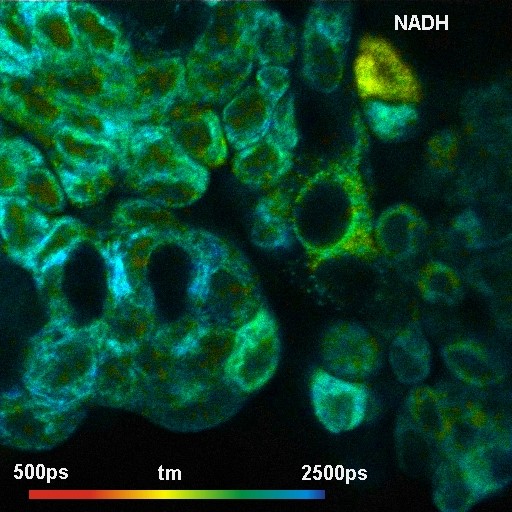
excised during tumor surgery. Fig.
5 shows NAD(P)H images of the amplitude-weighted
lifetime, tm. The left image shows normal cells, the right image tumor cells.
(The right image contains also some normal cells, especially in the upper part.
This is unavoidable due to the procedure by which the cells were excised.) As
expected, tm is shorter in the tumor sample.
NAD(P)H images of the amplitude, a1,
of the fast decay component are shown in Fig.
5. There is a clear difference in a1 between the normal
cells and the tumor cells. The normal cells have an average a1 of about 0.65
(or 65% of the total amplitude). The cancer cells have between 75% and 80%. The
values are in agreement with [10]. We find similar values consistently in data of
different cells.
FAD data are shown in Fig. 6. In general, also the FAD data show the expected
trend. a1 decreases for the cancer cells, indicating that they
contain less bound FAD (note a1 is the bound component of FAD). However, the details are not entirely
plausible. On the one hand, cells in the upper part of Fig. 6, right, have a significantly different a1
then the cells in the normal-cell sample (Fig.
6, left). On the other hand, in the NAD(P)H images the
same cells have the same a1
as the cells in the 'normal' sample (compare Fig.
5, left and right). However, there is a possible
explanation. The redox ratio in the tumor sample may be so low that the FAD
intensity gets extremely weak. It is then possible that residual NAD(P)H
fluorescence excited by the 405-nm laser is detected in the FAD channel. The fluorescence
in the yellow cells in Fig.
6 may then be from NAD(P)H, not FAD. A inspection of
the decay curves in the yellow areas shows indeed that the decay functions are
more compatible with NAD(P)H then with FAD. An improvement can probably be
obtained by using a slightly longer excitation wavelength for FAD excitation.
Fig.
7 shows the FLIRR calculated from the same data sets. As
expected, the FLIRR shifts to lower values for the cancer cells.
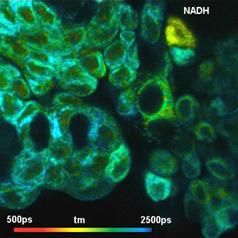
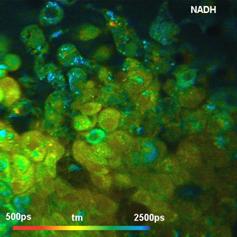
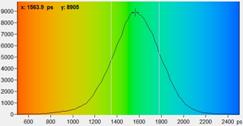
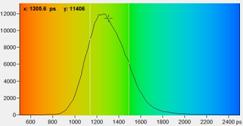
Fig. 4: NAD(P)H tm images for normal cells
(left) and tumor cells (right). Lower row: Histograms of tm over the pixels of
the images. As expected, tm is shorter in the tumor sample.
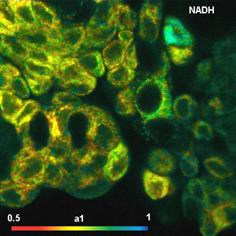
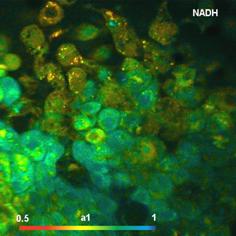

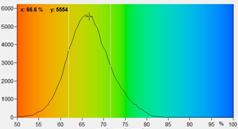
Fig. 5: NAD(P)H a1 images for normal cells (left) and tumor cells (right).
Lower row: Histograms of a1 over the pixels of the images. The histogram of the
tumor sample is from lower half of the image because the upper half contains
also normal cells.
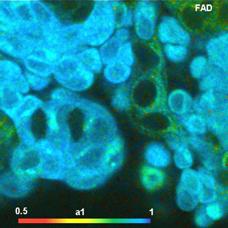
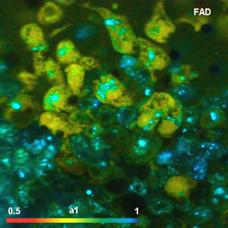
Fig. 6: FAD a1 images for normal cells (left) and tumor cells (right).
Lower row: Histograms of a1 over the pixels of the images. The histogram of the
tumor sample is from lower half of the image because the upper half contains
also normal cells.
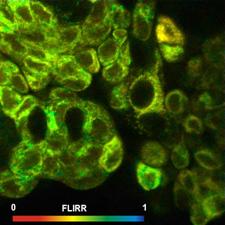
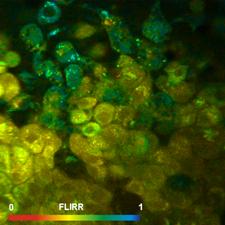
Fig. 7: FLIRR images of normal cells (left) and tumor cells (right). Lower
row: Histograms of the FLIRR over the pixels of the images. The histogram of
the tumor sample is from lower half of the image.
Summary
Metabolic information from live cells
can be obtained from FLIM data of NAD(P)H and FAD. Both compounds appear in a
bound and an unbound form. Both forms have different fluorescence lifetimes. A
shift from oxydative phosphorylation to glycolysis or vice versa causes a
change in the composition of the decay functions. For obvious reasons, it is
desirable to record the images for NAD(P)H quasi-simultaneously. This was
achieved by multiplexing two ps diode lasers, of 375nm and 405nm wavelength,
and recording FLIM data into different routing channels of two TCSPC modules. One
of the two modules detected in the emission range of NAD(P)H, the other in the
emission range of FAD. The required recording and data analysis functions are
available in the bh DCS-120 confocal Scanning FLIM System. Data recorded with
this system show that the distribution of the mean lifetimes, tm, and,
especially, the distribution of the amplitude of the fast decay component, a1,
in the NAD(P)H and in the FAD images are different for normal cells and tumor
cells. Differences were also found in
the Fluorescence-Lifetime Redox Ratio, FLIRR.
Acknowledgement
The work described in this note was performed
under the support of German BMBF, project Endoskopische Panoramabildgebung und
faseroptische Spektroskopie in der Urologie zur Multi-Dimensionalen Diagnostik.
References
1.
S. R. Alam, H. Wallrabe, Z.
Svindrych, A. K. Chaudhary, K. G. Christopher, D. Chandra, A. Periasamy,
Investigation of Mitochondrial Metabolic Response to Doxorubicin in Prostate
Cancer Cells: An NADH, FAD and Tryptophan FLIM Assay. Scientific Reports 7
(2017)
2.
W. Becker, Advanced time-correlated single-photon counting techniques. Springer, Berlin, Heidelberg,
New York, 2005
3.
W. Becker, Introduction to Multi-Dimensional TCSPC. In W. Becker (ed.) Advanced
time-correlated single photon counting applications. Springer, Berlin, Heidelberg,
New York (2015)
4.
W. Becker, The bh TCSPC
Handbook. 7th edition (2017). Available on www.becker-hickl.com. Please contact
bh for printed copies.
5.
Becker & Hickl GmbH,
DCS-120 Confocal and Multiphoton FLIM Systems, user handbook, 7th edition
(2017). www.becker-hickl.com. Please contact bh for
printed copies.
6.
B.
Chance, Pyridine nucleotide as an indicator of the oxygen requirements for
energy-linked functions of mitochondria. Circ Res 38, I31I38 (1976)
7.
B.
Chance, B. Schoener, R. Oshino, F. Itshak, Y. Nakase, Oxidationreduction ratio
studies of mitochondria in freeze-trapped samples. NADH and flavoprotein
fluorescence signals J. Biol. Chem. 254, 47644771 (1979)
8.
J.R. Lakowicz, H. Szmacinski,
K. Nowaczyk, M.L. Johnson, Fluorescence lifetime imaging of free and protein-bound
NADH, PNAS 89, 1271-1275 (1992)
9.
J.R. Lakowicz, Principles of
Fluorescence Spectroscopy, 3rd edn., Spriner (2006)
10.
M.N.
Pastore, H. Studier, C.S. Bonder, M.S. Roberts, Non-invasive metabolic imaging
of melanoma progression. Exp. Dermatol. 26, 607614 (2017)
11.
R.J. Paul, H. Schneckenburger,
Oxygen concentration and the oxidation-reduction state of yeast: Determination
of free/bound NADH and flavins by time-resolved spectroscopy,
Naturwissenschaften 83, 32-35 (1996)
12.
P.M.
Schaefer, D. Hilpert, M. Niederschweiberer, L. Neuhauser, S. Kalinina, E.
Calzia, A. Rueck, B. von Einem, C.A.F. von Arnim, Mitochondrial matrix pH as a
decisive factor in neurometabolic imaging. Neurophotonics 4(4):045004 (2017)
13.
P. M. Schaefer, S. Kalinina, A.
Rueck, C.A.F. von Arnim, B. von Einem, NADH Autofluorescence - A Marker on its
Way to Boost Bioenergetic Research. Cytometry Part A, 1-13 (2018)
14.
D. Schweitzer, S. Schenke, M.
Hammer, F. Schweitzer, S. Jentsch, E. Birckner, W. Becker, Towards Metabolic
Mapping of the Human Retina. Micr. Res. Tech. 70, 403-409 (2007)
15.
M.C. Skala, A. Fontanella, L.
Lan, J.A. Izatt, M.W. Dewhirst, Longitudinal optical imaging of tumor metabolism
and hemodynamics. J. Biomed. Opt. 15(1) 011112-1 to -8 (2010)
16.
M.C. Skala, N. Ramanujam,
Multiphoton Redox Ratio Imaging for Metabolic Monitoring in vivo. Methods Mol.
Biol. 594, 155-162 (2010)
17.
H.
Wallrabe, Z. Svindrych, S. R. Alam, K. H. Siller, T. Wang, D. Kashatus, S. Hu,
A. Periasamy, Segmented cell analyses to measure redox states of
autofluorescent NAD(P)H, FAD & Trp in cancer cells by FLIM. Sci. Reports
8:79, 1-11 (2018)
18.
A. Walsh, R.C. Cook, B. Rexer,
C.L. Arteaga, M.C. Skala, Optical Imaging of metabolism in HER2 overexpressing
breast cancer cells. Biomedical Optics Express 3(1), 75-85 (2012)
19.
A. J. Walsh, R. S. Cook, M. E.
Sanders, L. Aurisicchio, G. Ciliberto, C. L. Arteaga, M. C. Skala, Quantitative
Optical Imaging of Primary Tumor Organoid Metabolism Predicts Drug Response in
Breast Cancer. Cancer Res 74, OF1-OF11 (2014)
20.
A.
J. Walsh, M. C. Skala, Optical metabolic imaging quantifies heterogeneous cell
populations. Biomed. Opt. Expr. 6, 559-573 (2015)
21.
O. Warburg, On the origin of
cancer cells. Science 123, 309-314 (1956)
22.
O. Warburg, On respiratory
impairment in cancer cells. Science 124, 269-270 (1956)
Contact:
Wolfgang Becker
Becker & Hickl GmbH
Berlin, Germany
Email: becker@becker-hickl.com
info@becker-hickl.com