Suppression of Lens Fluoresence in FLIO Images of Cataract Patients
Wolfgang
Becker, Axel Bergnamm, Becker & Hickl GmbH, Berlin, Germany
Abstract: Abnormally long lifetimes in FLIO data almost always result from
contamination of the fundus fluorescence by fluorescence of the crystalline
lens. Here, we show how the problem can be identified and the correct fundus
lifetimes be obtained.
Keywords: FLIM, FLIO, Lens Fluorescence,
Cataract
Example of Long-Lifetime Data
An example of a FLIO image with unexpectedly
long lifetime is shown in Fig. 1. The image shows the amplitude-weighted
lifetime, tm, of a triple-exponential decay model. The image shows a uniformly
blue area, without any indication of an image. To inexperienced users it may
look like a malfunction of the instrument or the data analysis software.
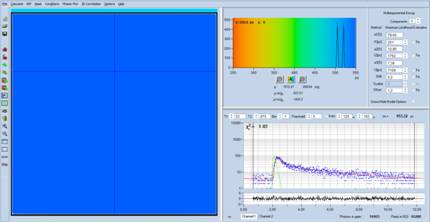
Fig. 1: FLIO
data with long tm
The explanation of the unusual image is
easy: The lifetimes of all pixels are out of the lifetime-display range, in
this case 250 ps to 550 ps. Moreover, the intensity settings,
'brightness' and 'contrast', both have been set to 100%, see Fig. 2, left.
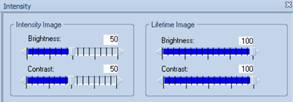
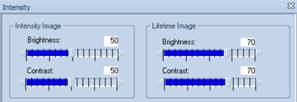
Fig. 2:
Brightness and Intensity settings for the FLIO image
100% settings are commonly used in FLIO
images. They are, however, not a good solution because they suppress any
intensity contrast in the image. With the lifetime out of range, you cannot
tell whether or not an image has been recorded at all. We therefore discourage
to use 100% intensity and contrast. With both values set to 70% the image
becomes as shown in Fig. 3. The figure clearly shows that an image was
recorded. Obviously, the problem is that the lifetimes are off range. An image
within a lifetime range from 250 ps to 2000 ps is shown in Fig. 4. It
looks like a normal FLIO image - with the exception that the lifetimes are too
long.
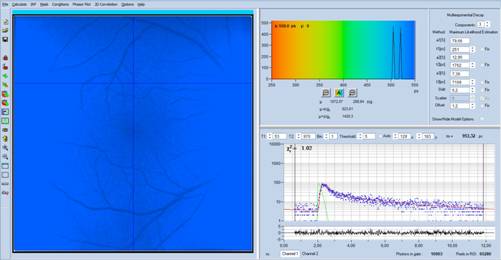
Fig. 3: Same data
as in Fig. 1, but with 70% contrast and 70% brightness.
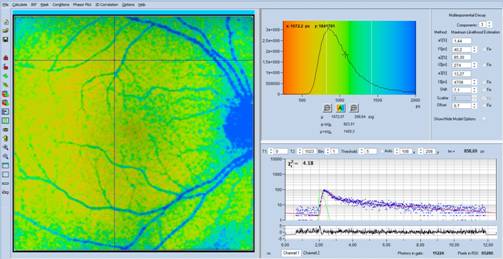
Fig. 4: Same
data as in Fig. 3, but with lifetime range 250 ps to 2000 ps
Where is the Long Lifetime Coming from?
A look at the decay data in Fig. 1 to Fig. 4,
upper right shows that there is a slow decay component, with a very long
lifetime, t3 = 4.7 ns, and a large amplitude, a3 = 13%. The
other decay components are, more or less, in the normal range. It is clear that
the long average lifetime, tm, is caused by the presence of this slow
component.
A clue of where the slow component comes
from is obtained from a close inspection of the decay data, see Fig. 5.
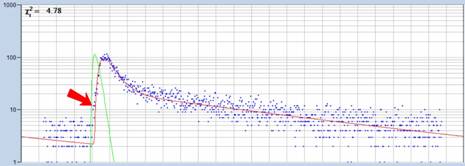
Fig. 5: Decay
curve in selected spot of the image, fit by triple-exponential standard model
Not only that the rising edge of the data
has an unusual shape, the triple-exponential model is also unable to fit the
rising edge of the data correctly. Obviously, there are photons which arrive
earlier than the conventional triple-exponential model can account for. The
only anatomic structures the early photons can come from are the cornea and the
crystalline lens.
The Shifted-Component Model
To account for lens and cornea fluorescence
in FLIO data we introduced the 'Shifted-Component' Model in SPCImage [2], see Fig.
6. Every decay component of the model function can be equipped with a shift in
time. Negative values mean a shift to shorter times, positive shift a shift to
longer times.
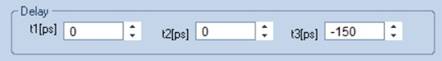
Fig. 6:
Parameters of Shifted Component Model
It turns out that a triple-exponential
model with a shift of -150 ps in the third component fits the data of
adult eyes perfectly, see Fig. 7. The model not only fits the rising edge
beautifully, there is also no oscillation in the residuals. A shift in the
first or second component does not deliver a similarly good fit. That means,
the third decay component indeed comes from the front structures of the eye.
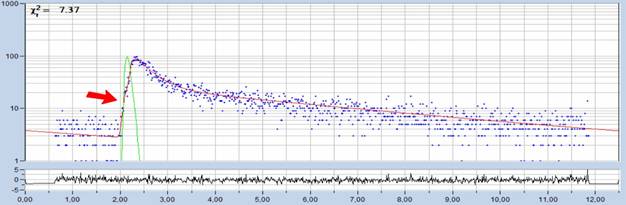
Fig. 7: Fit
of decay data with shifted component model, t3 = -150 ps
IRF Considerations
When the automatic IRF optimisation function
of SPCImage is used for FLIO it must be used with the shifted-component
model, see Fig. 8. With the standard double or triple exponential model the
procedure compensates the imperfection of the model with a wrong IRF. This IRF
is too long, with the result that the short lifetime component, t1, is
determined too short. Worse, the obtained IRF depends on the amount of lens
fluorescence. This leads to different t1 and t2 values for different amounts of
lens fluorescence. For the relationship of IRF modelling and shifted-component
model please see [1, 3] and [4].
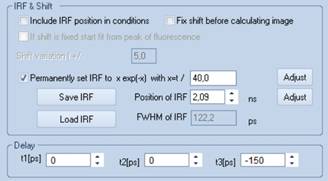
Fig. 8: The
IRF optimisation must be performed with the shifted-component model
Analysis with the Shifted-Component Model
Assuming that the third (i.e. the slowest)
decay component comes from the lens its lifetime contribution can be rejected
from the FLIO data. Analyse the data with the shifted-component model, and,
instead of using an average, tm, of all three decay components, use only the
components t1 and t2. These are the decay component that come from the fundus.
The amplitude-weighted average of t1 and t2 is available in SPCImage. Go into
'Colour' and select 'tm12' for colour coding tm12 in the image, see Fig. 9.
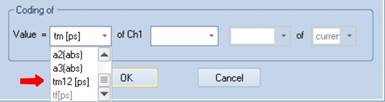
Fig. 9:
Selection of the average of t1 and t2 for colour coding
An example for the data shown in Fig. 1 is
presented in Fig. 10. The shifted-component model with three decay components
and a shift of t3 of -150 ps was used. The colour-coded lifetime is t12, i.e.
an amplitude-weighted lifetime of only t1 and t2. As can be seen from the image
and the lifetime histogram, the tm12 values are in the normal range of the
fundus lifetime.
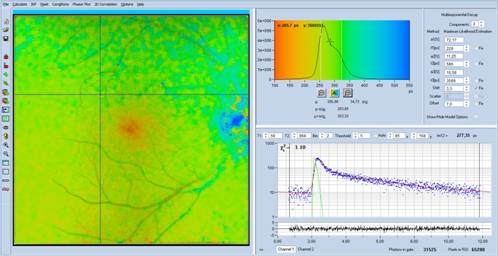
Fig. 10: Analysis
of the data shown in Fig. 1 with shifted-component model, colour-coding of tm12
Similar results have been presented in [5].
The authors compare pre-surgery and post-surgery FLIO results from a cataract
patient. As in the data presented here, pre-surgery data were heavily
contaminated by lens fluorescence. Conventional triple-exponential decay
analysis produced tm values which were completely out of range. Nevertheless,
the shifted-component model was able to extract correct fundus lifetimes, which
were later confirmed by post-surgery measurements. Results shown in [4]
demonstrate that even FLIO data cataract-free eyes contain a noticeable amount
of lens fluorescence. Shifted-component tm12 fundus lifetimes were about 20%
shorter than the conventional tm lifetimes.
Advice for Obtaining Correct FLIO Images
When the lifetimes are unusually long,
check the amplitude of the slowest decay component. Values larger than 5%
indicate that lens fluorescence is the problem. The source of strong lens
fluorescence can be cataract or poor focusing. Therefore, focus correctly on
the fundus. Imperfect focusing reduces the detection efficiency of the fundus
fluorescence and thus increases the relative amount of lens fluorescence. Use
the shifted-component model of SPCImage in combination with the synthetic IRF.
Use the average lifetime of the first two components, tm12, to reject lens
fluorescence from the data and to obtain pure fundus lifetimes. Record as many
photons as possible. Suppression of lens fluorescence requires
triple-exponential data analysis and thus a large number of photons.
References
1.
The bh TCSPC Handbook, 9th edition, 2021.
Chapter 'Ophthalmic FLIM'. Available on www.becker-hickl.com
2.
The bh TCSPC Handbook, 9th edition, 2021.
Chapter 'FLIM Data Analysis'. Available on www.becker-hickl.com
3.
Becker & Hickl GmbH, FLIO data acquisition
and analysis. The road to success. Application note in presentation-style,
available on www.becker-hickl.com
4.
W. Becker, Fluorescence-Lifetime Imaging
Ophthalmoscopy. Principles, Challenges, Solutions, and Applications. A Guide to
Beautiful FLIO Results. 3-hour lecture on FLIO and FLIO data analysis.
https://www.becker-hickl.com/literature/application-notes/fluorescence-lifetime-imaging-ophthalmoscopy-lecture-held-april-23-2021/
5.
W. Becker, A. Bergmann, L. Sauer,
Shifted-component model improves FLIO data analysis. Application note,
available on www.becker-hickl.com
Contact:
Wolfgang Becker
Becker & Hickl GmbH
Berlin, Germany
Email: becker@becker-hickl.com
