Two-Photon FLIM of Pollen Grains Reveals Ultra-Fast
Decay Component
Wolfgang Becker, Taravat
Saeb-Gilani, Cornelia Junghans, Becker & Hickl GmbH
Abstract: Using
our DCS-120 MP multiphoton FLIM system with ultra-fast detectors, we find
extremely fast fluorescence-decay components in a wide variety of biological
material. Here, we report on FLIM of pollen grains from a number of different
plants. We found decay components with lifetimes, t1,
from 10 ps to 80 ps, and with amplitudes, a1, as large as
93 %.
Experiment Setup
From earlier experiments we know that
fluorescence lifetimes of biological material can be in the sub-100-ps range. FLIM
of mushroom spores revealed decay components with lifetimes down to less than
10 ps [2], and FLIM of mammalian hair shows components in the range below
20 ps. The fast decay components are not only clearly detectable, they are
actually the dominating constituent of the decay functions. Normal one-photon
confocal systems with diode-laser excitation then show a short apparent
lifetime but do not reliably resolve the decay functions into individual decay components.
Our DCS-120 MP multiphoton system, in contrast, is able to show the fast decay
components directly. The instrument is based on fast beam scanning, two-photon
excitation with a femtosecond fibre laser (Toptica Femto Fibre Pro, 780 nm)
and detection by ultra-fast hybrid detectors (bh HPM-100-06) [3, 4, 5]. The laser is coupled free-beam into
the scan head, the fluorescence is transferred to the detectors via a
non-descanned beam path. The data are recorded by bh SPC-150 NX TCSPC/FLIM
modules using bhs multi-dimensional TCSPC technique [6]. Please see [1, 3] for
details. The instrument response of the DCS-120 MP system with the HPM-100-06
detectors is about 18 ps, full width at half maximum [4]. This is about 5
times faster than for a typical diode-laser based system with GaAsP hybrid
detectors, and 10 times faster than for FLIM systems with conventional PMT
detectors. Fast decay components thus become directly visible in the decay
curves, without the need of deconvolution from an IRF wider than the decay
time.
Sample Preparation and FLIM Procedure
Anthers were collected from fresh flowers
and placed on 180 µm thick microscope slides. Pollen released from the anthers
were collected on the slides, see Fig. 1. In some cases, especially when we were
not able to collect enough pollen, the entire anthers were left on the slides,
and embedded in immersion oil. The slides were then placed on the sample stage
of an inverted microscope, and FLIM recordings were taken.
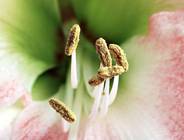
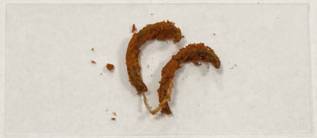
Fig. 1: Left: Stamens of Hippeastrum with anthers carrying pollen (from
www.wikipedia.org). Right: Anthers on a microscope slide to collect pollen.
For FLIM measurement we used an oil
immersion lens with NA = 1.3 numerical aperture, and 40x magnification.
The emitted photons were recorded via the non-descanned detection path of the
DCS-120 MP system. A Chroma SP 700 short-pass filter was used to reject
scattered excitation light, and a 400-nm long pass filter to suppress possible
SHG light. Consequently, fluorescence was detected from about 400 nm up to
the upper detection limit of the detector, which is about 650 nm.
We admit that, from the point of optics,
the configuration of the sample is not entirely correct. For best resolution,
the pollen should be embedded in a medium with a refractive index close to that
of glass. However, the usual embedding media cannot be used because they emit
too much fluorescence. Attempts to image the pollen grains in water or
immersion oil failed because the pollen grains were moving in the liquid. The
best and only way to run the experiments was to image the bare pollen on the glass
from the back of the slide, as described above.
Another problem is that the pollen,
especially those of brown or black colour, are likely to absorb at the
fundamental wavelength of the excitation laser. They are therefore easily
destroyed by the laser. To avoid any sample destruction, we kept the laser
power below 4 mW, in some cases even below 2 mW. Due to the low laser
power the photon detection rate was no higher than 100,000 to 300,000 counts
per second. Consequently, the data acquisition times were relatively long, typically
in the range from one to five minutes. The long acquisition time was no
problem, however, because our system has excellent timing stability and a detector
background count rate of no more than 60 counts per second [6].
FLIM Measurements
We recorded FLIM data from the pollen of
different flowers, see Fig. 2. The data were processed by SPCImage NG FLIM data
analysis software using a triple-exponential decay model [7]. The results are
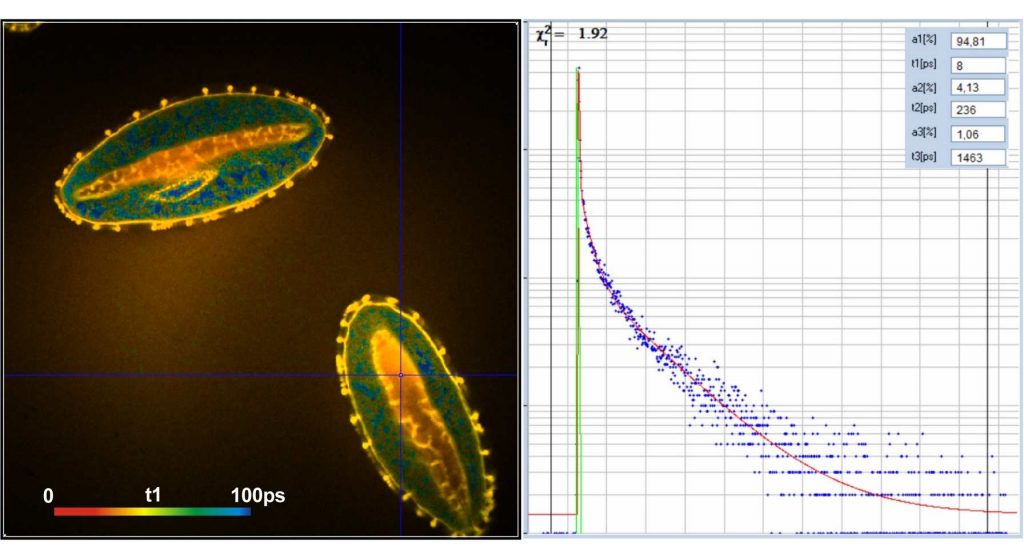
shown in Fig. 3. Left to right, the figure shows images of the
amplitude-weighted mean lifetime, tm, images of the fast decay component, t1,
and images of the amplitude of the fast component, a1. A decay curve in a
representative spot of the image is shown far right. The order of the images was
chosen by the tint of the pollen; pollen with bright colour are displayed on
the top, pollen with dark colour at the bottom.


Fig. 2: Flowers from the pollen of which FLIM data were recorded. Left to
right: Three different brands of Lilium orientalis, Papaver rhoeas.
As can be seen from the inserts in the
decay panels the lifetimes of the fast component, t1, range from 50 ps
down to 10 ps. The amplitudes of the fast component range from about 80%
to more than 90%. However, different than in earlier results from mushroom
spores, there is no correlation of these parameters with the tint of the pollen
grains.
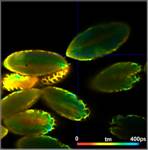
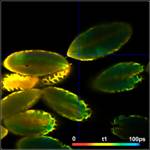

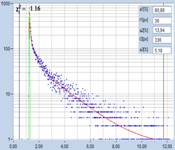
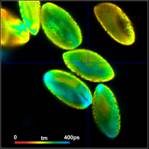
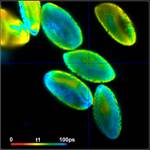
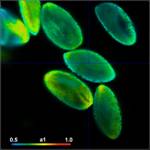
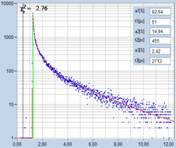
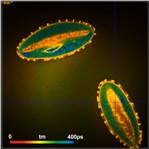
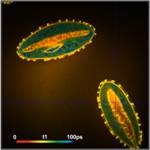
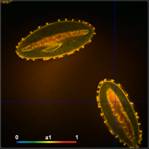
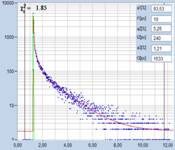
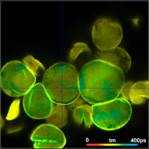
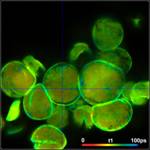
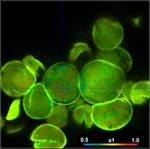
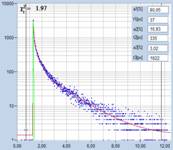
Fig. 3: Top to
bottom: Pollen of white Lilium orientalis, pink Lilium orientalis,
dark-pink Lilium orientalis, and Papaver rhoeas. Left to right:
Lifetime images of the mean (amplitude-weighted) lifetime, tm, the lifetime of
the fast decay component, t1, and the amplitude of the fast decay component. Decay
curves in a selected spot of the image are shown on the right, decay parameters
are shown in the inserts. Triple-exponential decay analyses with bh SPCImage
NG.
Fig. 4 and Fig. 5 show lifetime images taken
from intact anthers of Rhododendron catawbiense and Ranunkulus repens.
A tm image is shown on the left, decay curves in selected spots on the right.
Interestingly, the fastest decay time, t1, and the largest amplitude, a1, are
not found in the pollen but in the inner tissue of the anther. More than that,
we found the fast decay component also in other plant tissue, even in lifetime
images take from green leaves.
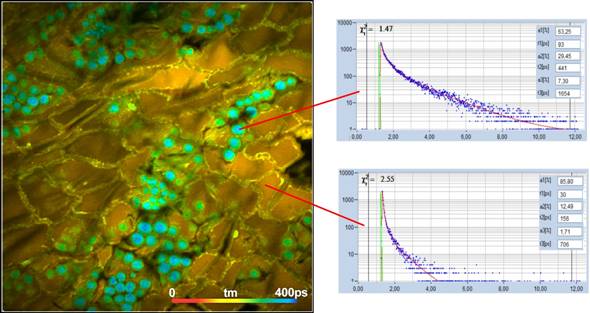
Fig. 4: tm image from the anther of a Rhododendron catawbiense. Fluorescence
decay curves in two selected spots shown on the right.
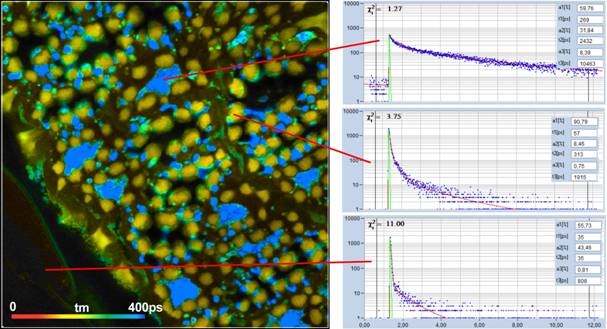
Fig. 5: tm image from the anther of Ranunkulus repens. Fluorescence
decay curves in three selected spots shown on the right.
It could be argued that the fast component
may not be real but caused by insufficiently blocked laser light or by
second-harmonic generation (SHG) in the tissue. However, an additional laser
blocking filter in front of the detector neither changed the signal intensity
nor the shape of the decay curves. Similarly, an additional long-pass filter
with 420 nm cut-off wavelength did not change the decay curves. Therefore
leakage of laser light or SHG can be excluded as a source of the fast decay. This
is further confirmed by the decay curves in Fig. 5. There are regions with
extremely fast decay (curve at the bottom) but also regions where the decay
functions look absolutely 'normal' (curve at the top). This supports the
assumption that the fast component is real.
We further checked whether the fast decay
component is somehow related to excitation with femtosecond pulses. For that
purpose, we recorded FLIM data with a 'normal' bh DCS-120 confocal FLIM system.
This system uses diode lasers for excitation. The pulse width is on the order
of 40 ps so that nonlinear effects can be excluded. A result is shown in Fig.
6.
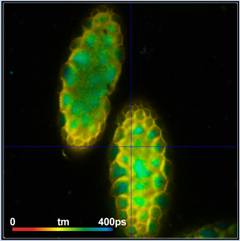
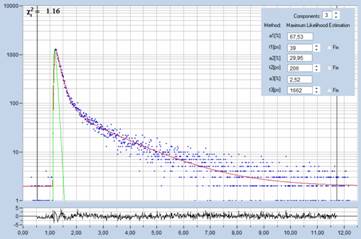
Fig. 6: Lilium orientale (white), image recorded by one-photon
confocal FLIM with diode-laser excitation. Left: tm image. Right: Decay
function of 10x10 pixel area around cursor position. Decay parameters shown in
insert.
Although the IRF of the system is much
wider than that of the MP system the decay function looks unusually steep and
fast. Triple-exponential decay analysis indeed turns up a fast decay component
of 39 ps with an amplitude of 67%. The results from the multiphoton
results are thus confirmed.
Discussion of the Results
With instrumental artefacts being excluded,
the question is where the fast fluorescence components are coming from, and why
they are preferentially found in plants. The most likely explanation is that
plants contain a wide variety of coloured compounds, such as Carotinoids and
Flavonoids [8, 9]. Most of these compounds are not known to be strongly
fluorescent. However, exactly the low fluorescence quantum yield may be the explanation
of the short lifetime: A molecule which absorbs light but has a dominating
non-radiative de-activation pathway will not be entirely free of fluorescence.
It will just fluoresce with an extremely short lifetime, of approximately the
reciprocal rate constant of the non-radiative pathway. If the sources of the
fast signals are indeed Carotinoids and Flavonoids they should be detectable also
in pigmented tissues of other organisms. Indeed, fast decay components with
lifetimes <80 ps are found in the fundus of mammalian eyes [10] and components
with lifetimes <20 ps in mammalian hair. The lower picosecond range of
FLIM should therefore no longer be neglected as a source of biological
information.
References
1.
W. Becker, The bh TCSPC handbook. 8th edition
(2019), available on www.becker-hickl.com
2. W. Becker, C. Junghans, A. Bergmann, Two-photon FLIM of mushroom
spores reveals ultra-fast decay component. Application note, Becker & Hickl
GmbH, available on www. becker-hickl.com
3. Becker & Hickl GmbH, DCS-120 Confocal and Multiphoton Scanning FLIM
Systems, user handbook 8th ed. (2019). Available on www.becker-hickl.com
4.
Sub-20ps IRF Width from Hybrid Detectors and
MCP-PMTs. Application note, available on www.becker-hickl.com
5. Becker & Hickl GmbH, Two-Photon FLIM with a femtosecond fibre laser.
Application note, available on www.becker-hickl.com
6. Becker & Hickl GmbH, The bh TCSPC Technique. Principles and
Applications. Overview brochure, available on www.becker-hickl.com.
7. Becker & Hickl GmbH, SPCImage Next Generation FLIM data analysis
software. Overview brochure, available on www.becker-hickl.com
8. Junko Yabuzaki, Carotenoids Database: structures, chemical
fingerprints and distribution among organisms. Database, 2017, 111, doi:
10.1093/database/bax004
9. Flavonoids. https://lpi.oregonstate.edu/mic/dietary-factors/phytochemicals/flavonoids
10. W. Becker, Fluorescence Lifetime Imaging Ophthalmoscopy
Principles, Challenges, Solutions, and Applications. Lecture, April 23, 2021.
Available on www.becker-hickl.com/literature/application-notes.
Contact:
Wolfgang Becker
Becker & Hickl GmbH
Berlin, Germany
Email: becker@becker-hickl.com