Ultra-Fast Fluorescence Decay in Malignant Melanoma
Wolfgang
Becker, Becker & Hickl GmbH, Berlin
Vladislav
Shcheslavskiy, Vadim Elagin, Privolzhskiy Research Medical University,
Nizhni Novgorod
Abstract: Using a multiphoton TCSPC-FLIM system with
ultra-fast detectors, we found extremely fast fluorescence-decay components in a
wide variety of biological material. Here, we report on FLIM of malignant
melanoma. We found decay components with lifetimes, t1,
from 10 ps to 20 ps, and with amplitudes, a1, as large as
98%. The lifetimes and amplitudes are in sharp contrast to the decay parameters
in healthy tissue (t1 = 185 ps, a1 =
55%) and in material from benign pigmented lesions (t1 = 96 ps, a1 = 45%).
Introduction
It is commonly believed that autofluorescence
lifetimes of biological material are in the range from a few 100 ps to
about 5 ns. This is supported by fluorescence-decay data of NADH, which
exhibits a lifetime of about 400 ps for the free form and 3 ns for
the protein-bound form, and of FAD, with about 250 ps for the bound form
and 2 ns for the free form [6, 14]. Lifetimes of other endogenous
fluorophores are in the same range, with fast decay components down to about
200 ps [16]. The fact that there are no faster decay times known may in
part be due to the limited time resolution of the instruments. Commonly used
FLIM systems have instrument response functions with a full width at
half-maximum (fwhm) of about 250 ps (when using PMT detectors) and 100 ps
(when using hybrid detectors with GaAsP cathodes) [1]. Faster fluorescence
decay times may therefore have eluded attention, especially when they appeared
as components of a multi-exponential decay.
Recently, Becker & Hickl GmbH Berlin,
have introduced ultra-fast hybrid detectors and ultra-fast TCSPC-FLIM modules to
their FLIM systems [1, 11]. In
combination with femtosecond-lasers and two-photon excitation the systems
deliver an IRF of <20 ps fwhm [1, 9, 10]. We have used the systems to look for
extremely fast fluorescence decay processes in a variety of biological samples.
The result was a surprise. Ultra-fast decay components were found in mushroom
spores [2], pollen grains [3], in
carotenoids [4], and even in Scottish
whiskey [5]. Lifetimes were
found as short as 10 ps, and amplitudes as large as 0.99. In mushroom
spores, the amplitude and the lifetimes were strictly related to the colour [2].
An equivalent, yet not similarly strict relationship was found for pollen and
plant tissue [3].
There have been earlier indications that short
fluorescence lifetimes occur also in tissue of malignant melanoma. Decreased
fluorescence lifetimes have been found by Dimitrow et al. [12, 13] and by Seidenari et al. [17]. With the limited time resolution of the
instruments used, it was not possible to decide whether the reported lifetimes were
the true lifetime of the melanoma tissue, whether the resulting decay functions
were single- or multiexponential, and which of the decay components were the
source of the change. It also remained an open question whether the lifetime
changes were a result of a change in the bound / unbound ratio of NADH, as
found by Pastore et al. [15], or a result of the presence of fluorophores with
extremely short decay times. Having ultra-fast FLIM systems at hand, it was
therefore a logical step to look for fast decay in tissue samples from
malignant melanoma.
Experiment
For melanoma imaging we used a bh FLIM
system attached to a Zeiss LSM 880 NLO multiphoton microscope in the
inverted (Axio Observer) version [10]. HPM-100-06 hybrid detector modules
(Becker & Hickl GmbH) were attached to the NDD port of the
LSM 880 NLO via a Zeiss NDD beamsplitter module. The recording
electronics consisted of two parallel SPC-150 N modules and a DCC-100
detector controller (all Becker & Hickl GmbH). Fluorescence was excited by
two-photon absorption of the near-infrared femtosecond laser of the
LSM 880 NLO, FLIM data were recorded by bhs
multi-dimensional TCSPC technique [1]. The instrument response of the FLIM
system is about 18 ps, full width at half maximum [7]. This is about 5
times faster than for systems with GaAsP hybrid detectors, and 10 times faster
than for FLIM systems with conventional PMT detectors. Fast decay components
thus become directly visible in the decay curves, without indirect evidence by deconvolution
from an IRF wider than the decay time.
For imaging of benign skin lesions we used
a similar system based on the bh DCS-120 scanner and a femtosecond fibre laser
[11].
Fresh tumor samples were obtained from
tumor surgery at the Institute of Transplantology, Nizhi Novgorod, and imaged
within 1 hour after being excised. A 40x NA = 1.2 water immersion lens was
used. To obtain a good match of the refractive index on the way to the sample
and back the samples were placed in cell dishes and the space between the glass
and the sample surface filled with buffer solution. The excitation wavelength
was 750 nm, the detection wavelength interval from 435 nm 485 nm. A 690 nm
short-pass filter of Chroma was used to block scattered excitation light. The
back side of the sample was protected by a black cover to avoid daylight pickup
and to avoid fluorescence light to be reflected back into the beam path from
the condensor lens or the lamp reflector. Such reflections show up as nasty
distortions in the decay data, especially when the decay functions contain fast
decay components of large amplitude.
Data analysis was performed by bh SPCImage
NG, using an MLE fit and triple-exponential decay models [8].
Results
FLIM results obtained from the melanoma are
shown in Fig. 1 and Fig. 2. Fig. 1 shows a lifetime image of a vertical section
through the tissue. Superficial layers are shown on the right in the image,
deeper layers on the left. Colour coding shows the amplitude-weighted lifetime,
tm, obtained by fitting the decay data by a triple-exponential model [1, 8]. As can be seen from the image, the
lifetime is extraordinarily short in a layer close to the surface of the
tissue. The lifetime is about 20 ps in the superficial layers (orange
areas), and about 1200 ps in deeper layers (green areas). A closer
inspection of the data shows that the short lifetime is caused by the presence
of an extremely fast decay component. An image displaying the lifetime of the
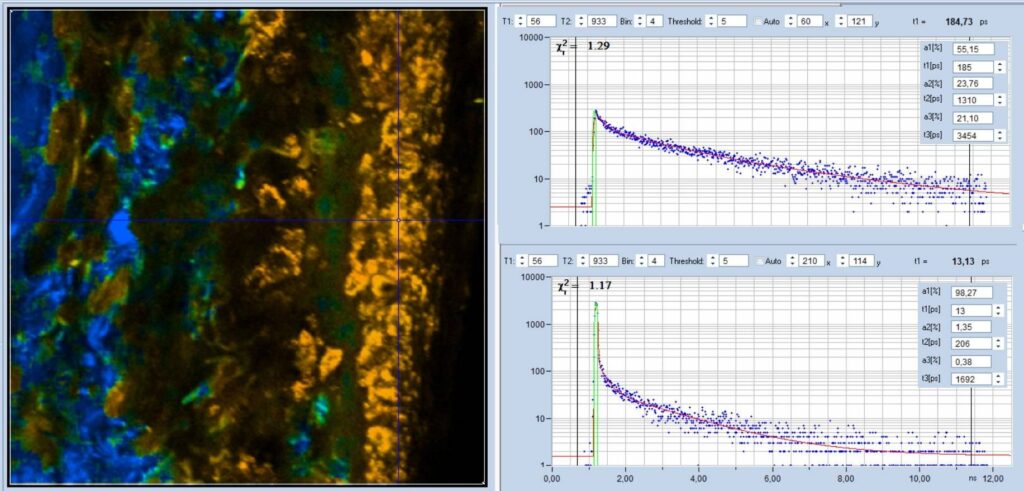
fastest component, t1, of the triple-exponential decay is shown in Fig. 2.
Decay curves from selected spots of the image are shown on the right. The short
value of t1 shows up clearly in the t1 image. It is visible as a sharp peak in
the decay curve from the superficial tissue layer, see bottom, right. The fit
delivers a lifetime, t1, of 13 ps and an amplitude, a1, of 98% for the
fast component. The amplitude ratio, a1/(a2+a3), is about 57, which is
unusually high for biological material. The peak is not present in the decay
curve from deep tissue layers, see top right. The component lifetimes in these
areas are in a more or less 'normal' range, and compatible with a mixture of
NADH, FAD, and possibly FMN [6]. The parameters are t1 = 185 ps,
a1 = 23.8%, a1/(a2+a3) = 0.31.
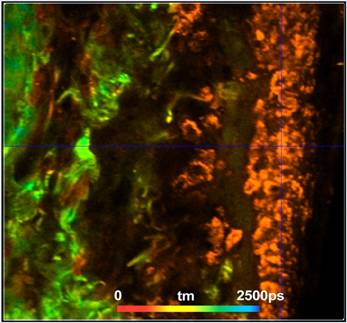
Fig. 1: Vertical section through melanoma sample, colour-coded image of
the amplitude-weighted lifetime, tm, of a triple-exponential fit of the decay
data. Red to blue corresponds to 0 ps to 2500 ps.
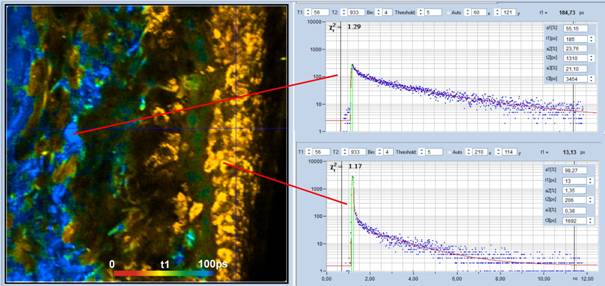
Fig. 2: Colour-coded image of the lifetime of the fast component, t1, of a
triple-exponential fit of the data. Red to blue corresponds to 0 to
100 ps. Decay curves in characteristic spots of the image are shown on the
right.
For comparison, Fig. 3 shows a FLIM image
of a sample from a benign pigmented lesion recorded under similar conditions. A
tm image is shown on the left, a decay curve from a selected spot on the right.
As can be seen from the figure there is no ultra-fast component of high
amplitude, as in the melanoma data. The fast decay component has a lifetime of
96 ps, and an amplitude of 45%. The amplitude ratio, a1/(a2+a3), is about
0.8, i.e. 70 times smaller than for the malignant melanoma.
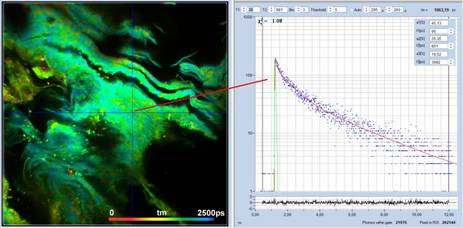
Fig. 3: Left: tm image of a sample from a benign pigments skin lesion. Red
to blue corresponds to tm = 0 ps to 2500 ps. Right: decay curve in a selected
spot of the image. There is no high-amplitude ultra-fast decay component.
Discussion of the Results
Fluorescence decay functions measured in
malignant-melanoma tissue differ significantly from that in normal skin tissue,
and from the tissue of benign pigmented lesions. The most striking difference
is in the lifetime of the fast decay component, t1, and in the amplitude ratio
of the fast component, a1/(a2+a3). The decay parameters can potentially be used
to identify malignant melanoma, and to investigate their development
mechanisms. Ultra-fast decay effects should therefore no longer be put aside as
a peculiarity but considered as a potential source of biological information.
As for the origin of the fast decay
component we can only speculate. It is reasonable to assume that it comes from
special forms of melanin. A likely source are aggregates, forming by the high
concentration of melanin in the melanoma. It is not unusual that aggregates
exhibit extremely short fluorescence lifetimes, and it would not be surprising
if the same effect occurred for melanin. However, why other material with high
melanin content does not show the fast decay component remains an open
question.
References
1.
W. Becker, The bh TCSPC handbook. 9th edition
(2021), available on www.becker-hickl.com
2. W. Becker, C. Junghans, A. Bergmann, Two-photon FLIM of mushroom
spores reveals ultra-fast decay component. Application note, Becker & Hickl
GmbH, available on www. becker-hickl.com
3. W. Becker, T. Saeb-Gilani, C. Junghans, Two-Photon FLIM of Pollen
Grains Reveals Ultra-Fast Decay Component. Application note, Becker & Hickl
GmbH, available on www. becker-hickl.com
4. W. Becker, A. Bergmann, C. Junghans, Ultra-Fast Fluorescence Decay
in Natural Carotenoids. Application note, available on www. becker-hickl.com
5. W. Becker, J. Heitz, A. Bergmann, Ultra-Fast Fluorescence Decay in
Scottish Whisky. Application note, Becker & Hickl GmbH, available on www.
becker-hickl.com
6. W. Becker, L. Braun, DCS-120 FLIM System Detects FMN in Live Cells,
application note, available on www.becker-hickl.com.
7. Becker & Hickl GmbH, Sub-20ps IRF Width from Hybrid Detectors
and MCP-PMTs. Application note, available on www.becker-hickl.com
8. Becker & Hickl GmbH, SPCImage Next Generation FLIM data analysis
software. Overview brochure, available on www.becker-hickl.com
9. Becker & Hickl GmbH, DCS-120 Confocal and Multiphoton Scanning FLIM
Systems, user handbook 9th ed. (2021). Available on www.becker-hickl.com
10. Becker & Hickl GmbH, Modular FLIM systems for Zeiss
LSM 710 / 780 / 880 family laser scanning microscopes. User
handbook, 7th ed. (2017). Available on www.becker-hickl.com
11. Becker & Hickl GmbH, Two-Photon FLIM with a femtosecond fibre
laser. Application note, available on www.becker-hickl.com
12. E. Dimitrow, I. Riemann, A. Ehlers, M. J. Koehler, J. Norgauer, P.
Elsner, K. König, M. Kaatz, Spectral fluorescence lifetime detection and
selective melanin imaging by multiphoton laser tomography for melanoma
diagnosis. Experimental Dermatology 18, 509-515 (2009)
13. E. Dimitrow, M. Ziemer, M. J. Koehler, J. Norgauer, K. König, P.
Elsner, M. Kaatz, Sensitivity and Specificity of Multiphoton Laser Tomography
for In Vivo and Ex Vivo Diagnosis of Malignant Melanoma. J. Invest. Dermatol.
12(7) 1752-1758 (2009)
14. J.R. Lakowicz, Principles of Fluorescence Spectroscopy, 3rd edn.,
Springer (2006)
15. M.N. Pastore, H. Studier, C.S. Bonder, M.S. Roberts, Non-invasive
metabolic imaging of melanoma progression. Exp. Dermatol. 26, 607614 (2017)
16. D. Schweitzer, S. Schenke, M. Hammer, F. Schweitzer, S. Jentsch, E.
Birckner, W. Becker, Towards Metabolic Mapping of the Human Retina. Micr. Res.
Tech. 70, 403-409 (2007)
17. S. Seidenari, F. Arginelli, C. Dunsby, P. M. W. French, K. König, C.
Magnoni, C. Talbot, G. Ponti, Multiphoton Laser Tomography and Fluorescence
Lifetime Imaging of Melanoma: Morphologic Features and Quantitative Data for Sensitive
and Specific Non-Invasive Diagnostics. PLOS One, 8(7) e70682-1 to -9 (2013)
Contact:
Wolfgang Becker
Becker & Hickl GmbH
Berlin, Germany
Email: becker@becker-hickl.com