Ultra-Fast Fluorescence Decay in Natural Carotenoids
W. Becker, A.
Bergmann, C. Junghans
Becker & Hickl GmbH, Berlin, Germany
Abstract: We used the bh DCS-120 MP multiphoton system with fs-laser
excitation and ultra-fast detectors to record the fluorescence decay of natural
carotenoids. In all cases, the fluorescence was dominated by fast decay
components, with lifetimes down to 8.6 ps and amplitudes up to 99%.
Motivation
Carotenoids are present in almost any live
species on this planet. In plants and algae, they assist photosynthesis via an
additional light-harvesting complex and protect the cells against
photo-oxidative stress [15]. In animals, carotenoids and their derivatives are
providing the colours of fish, reptiles, and birds. Moreover, carotenoids play
a role as UV absorbers and as scavengers of reactive oxygen species. In
mammals, carotenoids are present in almost all organs, such as skin, liver,
brain, ovaries, prostate, and blood [11, 13, 17]. In the eye, carotenoids present a
dominating portion of the macular pigment [16].


Fig.
1: Carotenoids from the objects shown were investigated in the study presented
here. Left to right: Carrot, grape, tomato, blueberry, elder fruits, egg yolk.
It is presumed - in some cases even known -
that carotenoids are essential to the function of the organs. Moreover, there
are indications that they act as anti-oxidative and anti-inflammatory agents,
and that they have anti-bacterial, anti-viral, and even anti-cancer functions [10].
Well known is the effect of b-carotene and lutein on the macula of the human eye [10, 16].
It would therefore be desirable to
investigate these effects directly on the cell level. This can be done best by
using fluorescence lifetime and fluorescence lifetime imaging (FLIM) techniques
[1, 2]. For example, the
metabolic state of a cell can be determined by FLIM of NADH and FAD [2]. With
this technique, possible effects of physiologically active compounds can be
seen within minutes, compared to weeks, months or even years required for
clinical studies. In such studies, it would be desirable to see not only the
effect on the cell metabolism but also the uptake and metabolisation of the carotenoids
themselves. Unfortunately, there is a problem: Carotenoids are virtually non-fluorescent.
Fluorescence quantum yields given in the literature are on the order of 10‑4
to 10-5 [12] so that detection of fluorescence is extremely challenging.
This is especially the case in a biological environment where other
fluorophores with much higher quantum yield are present.
Fortunately, the problem of low
fluorescence quantum efficiency is less relevant for time-resolved
measurements. Low quantum efficiency means that the non-radiative decay rate is
much higher than the radiative one. In turn, that means that the fluorescence
decay time becomes short. It can become very short, if the quantum
efficiency is on the order of 10-3 or less. In practice, there is a
reciprocal relation between the fluorescence lifetime, tfl, and the fluorescence quantum efficiency, QEfl :
tfl = t0 / QEfl
t0 = natural fluorescence lifetime in absence of non-radiative decay
Importantly, the fluorescence quantum
efficiency has no influence on the intrinsic peak intensity of the fluorescence
decay function. Technically, that means that the fluorescence is well
detectable as long as the lifetime remains longer than the temporal resolution,
or the 'IRF' width [2]) of the measurement system. Please see Fig. 2.


Fig. 2: Amplitude of recorded decay functions for different tfl. Left: With a slow IRF the amplitude of the recorded curve
decreases with decreasing lifetime. Right: With a fast IRF the amplitude
remains constant.
Experiment Setup
For the measurement of extremely fast
fluorescence decay a short IRF of the excitation and detection system is essential.
We therefore used our DCS-120 MP multiphoton FLIM system [6] for recording the
data. Since the excitation pulses have femtosecond width the pulse shape does
not contribute to the effective IRF of the system. Moreover, in contrast to
cuvette systems, there is no geometric broadening of the IRF by transit-time
differences in the cuvette and in a monochromator. In combination with
ultra-fast hybrid detectors and ultra-fast TCSPC/FLIM modules the system
delivers an IRF width of less than 20 ps, FWHM [5]. A photo of the DCS-120 MP is shown in Fig.
3, left, the optical principle is shown in Fig. 3, right.


Fig. 3: Left:
DCS-120 MP FLIM system. Right: Principle of optical system
The system consists of a Toptica
Femto-Fibre Pro laser (780 nm, 40 MHz, 120 fs), a bh DCS-120
scan head [2, 6, 7], a Nikon
TE 2000 inverted microscope, non-descanned detection optics, and bh
HPM-100-06 hybrid detectors [2, 5]. The single-photon pulses of the detectors
are processed by two parallel SPC-180NX TCSPC / FLIM modules (electrical
IRF width 3.5 ps) [2, 3]. For further details please see [2] and [6].
Procedures
Extracts from the objects under
investigation were obtained by gently heating them to about 60 °C and pressing
fluid out of them. The extracts were placed in Ibidi cell dishes which were put
under the microscope. The image plane was selected first visually by
identifying the glass / solution interface, and then shifting the focus
further into the solution by an estimated 10 µm. The correctness of
focusing was checked in the 'Preview' mode of the DCS-120 system. Decay data
were taken in the 'Single' mode of SPCM software while letting the system scan
an area of about 50 µm. Scanning was used to avoid heat concentration in
the detection volume. An NA=1.3 oil immersion objective lens was used. The high
NA not only provides maximum excitation and detection efficiency, it also
cancels possible anisotropy-decay effects [2]. The data were collected in
Detector 1 only, with filters F1 = 680 nm short pass and L2 =
400 nm long pass (see Fig. 3). That means virtually all fluorescence from
400 nm to 680 nm was recorded. F1 bocks residual excitation light, F2
blocks possible second-harmonic generation (SHG) light from the detectors.
It may be objected that 780 nm is not
the best excitation wavelength for carotenoids. One-photon absorption maxima
are in the range of 450 to 500 nm [14], so that the two-photon absorption maximum
should be expected around 900 to 1000 nm. However, 2‑photon
excitation spectra are usually broader than 1‑photon spectra, and there
is always some absorption at the short-wavelength side of the maximum. As a
result, there were no problems to obtain reasonable intensities from all sample
investigated. Typical count rates were 50,000 s-1 to
100,000 s-1, with a laser power of 5 to 10 mW in the
sample plane.
Results
Carrot
The carrot is the prototype of
carotene-containing plants in that the pigment is composed almost completely of
b-Carotene.
A decay curve of carrot extract is shown in Fig. 4.

Fig. 4: Decay function of carrot extract. Linear scale, 1.2
ps / time channel, 4096 channels, total recording-time interval
5 ns.
As expected, the decay curve is dominated
by an ultra-fast component. To give an impression of how strong the component
is, the curve is shown in linear scale. Analysis with SPCImage NG yields a
component lifetime of 8.6 ps, and an amplitude of 99 %, see section 'Analysis
with SPCImage NG'.
To make sure that the recorded signal comes
from b-carotene we recorded a decay curve from the purified compound. As
can be seen from Fig. 5 the decay curves of the pure b-carotene and the carrot
extract are virtually identical, confirming that the signal from the carrot is
indeed b-carotene fluorescence.

Fig. 5: Decay curves of carrot extract and purified b-Carotene. The
decay functions are virtually identical.
Where in the Carrot is the b-Carotene?
To find out where in the carrot cells the b-Carotene is
located we performed 2-photon FLIM measurements of carrot tissue. In the FLIM
images, the presence of b-carotene is conveniently visible in the amplitude-weighted
lifetime, tm, of a triple-exponential decay analysis. In locations where b-carotene is
present tm is shorter than 100 ps, in locations where it is absent tm is
in the range of 3 ns. An example is shown in Fig. 6. The image shows that
the b-carotene is not evenly distributed but concentrated in distinct
clusters within the cells.

Fig. 6: Lifetime image of carrot tissue. Amplitude-weighted lifetime, tm,
of triple-exponential fit. Decay curves in locations without and with b-carotene shown
on the right.
Other Plant Pigments
We recorded decay data from a number of
pigmented fruits which are commonly found in urban environment. In all cases we
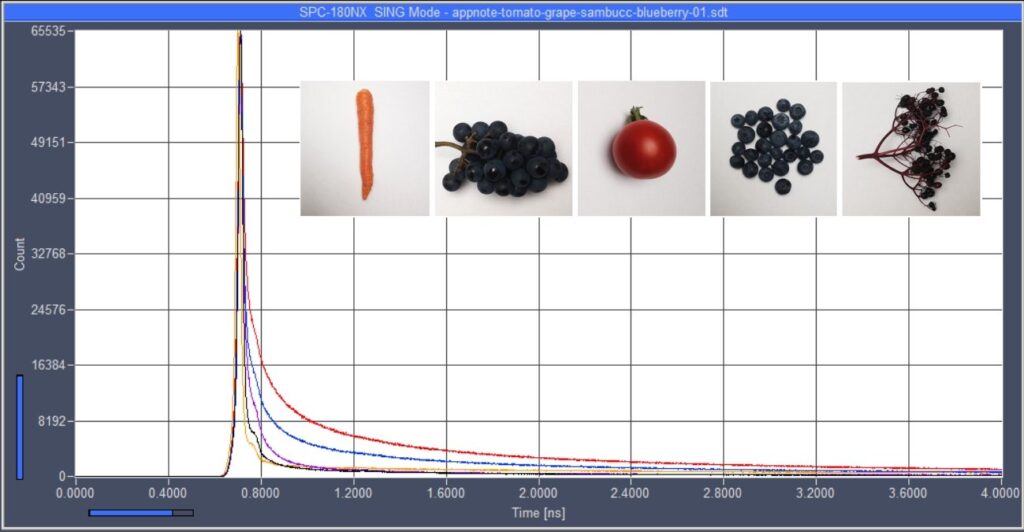
found ultra-fast decay components of high amplitude. Fig. 7 shows decay curves
of extracts of grape, tomato, blueberry, and black elder fruits. An
interpretation of the data is difficult because fruits contain mixtures of
different carotenoids. Moreover, carotenoids are not the only pigments in
fruits. Also anthocyanins may be present or even dominant [11]. The presence of
anthocyanins can be seen from the pH dependence of the colour which is characteristic
of anthocyanins but not of carotenoids.

Fig. 7: Decay
curves of extracts of tomato, grape, blueberry, and black elder.
For comparison, Fig. 8 shows decay curves
of a number of pure carotenoids and anthocyanins. Not surprisingly, also the
pure substances show extremely fast decay components.

Fig. 8: Decay
curves of lutein, astaxanthin, b-carotene, Lypcopene
Egg Yolk
Egg yolk contains lutein and zeaxanthin. The
compounds are very similar to b-carotene, differing only in the end groups of the conjugated
double-bond chain. Lutein and zeaxanthin are isomers, differing in the location
of one double bond in one of the end groups [13]. Because the length of the
double-bond chain does not differ by much it can be expected that the
spectroscopic properties are very similar. Fig. 9 shows decay curves of egg
yolk and egg white. As expected, the decay curve of the yolk shows an
ultra-fast component. However, there are also slower components. It is not known
whether these come from special modifications or special binding states of lutein
or zeaxanthin. Another (and possibly more likely) explanation is that the
components are fluorescence of NAD(P)H and/or FAD.

Fig. 9: Decay curves of egg yolk and egg white
For comparison, the figure also shows a
decay curve of the white of the egg. The fluorescence intensity is about 100
times lower than in the yolk, the decay time of the fast component is 44 ps,
and there is more background of slower fluorescence. The lifetimes of the slow
components are 507 ps and 3.5 ns, compatible with the assumption that
the slow fluorescence comes from NAD(P)H or FAD or a mixture of both. This
would even be an explanation of the fast component of 44 ps. As has been
shown in [8], FAD has a fast
decay component of about 55 ps which could easily account for the fast
component.
The lifetimes of the fast decay components
are close to or shorter than the IRF width of the detector. In principle, the
resolution could be increased by superconduction single-photon detectors
(SSPDs, IRF width 4.4 ps FWHM, including TCSPC) [9] or, possibly, ultra-fast
single-photon avalanche diodes (SPADs). However, such detectors have extremely
small active areas so that their use in a laser-scanning microscope is not
practicable.
It was therefore attempted to determine the
lifetimes with SPCImage TCSPC/FLIM analysis software. In principle, SPCImage
can determine lifetimes substantially shorter than the FWHM of the instrument
response by de-convolution. This requires, however, that the IRF be exactly
known. SPCImage provides two ways to include the IRF in the calculation. The
first one is to use a synthetic IRF. The IRF is modelled by a function of the
type t × e-t/t0, with the parameter t0 being determined by a fit
procedure [2, 4]. The procedure
is easy to use but does not account for possible bumps in the IRF. Low-amplitude
bumps in the IRF do not change the result significantly but make it difficult
the judge the quality of the fit.
The second way is to use a measured IRF.
This accounts for possible irregularities in the IRF shape but requires
accurate measurement of the IRF in exactly the same instrument configuration as
used for the fluorescence measurement. For a sub-20-ps IRF this is not easy.
As can be seen in Fig. 4 and Fig. 5 the IRF
of the detector is not entirely free of an afterpulse. For analysis of the data
we therefore used a measured IRF. The IRF was recorded from the SHG of finely powdered
sugar. Care was taken to avoid optical reflections (SHG is emitted in forward
direction!) and to avoid transit-time changes by different filter thickness.
Fig. 10 and Fig. 11 show results of the decay
analysis for carrot extract and tomato extract. The IRF is shown in green, the
fluorescence in blue. The red curve is a fit with a triple-exponential
incomplete-decay model [2, 4]. The decay parameters are shown upper right.

Fig. 10: SPCImage decay analysis of carrot extract. Blue: Fluorescence.
Green: IRF. Red: Fit with triple-exponential model. Decay parameters shown
upper right.

Fig. 11: SPCImage decay analysis of tomato extract. Blue: Fluorescence.
Green: IRF. Red: Fit with triple-exponential model. Decay parameters shown
upper right.
The decay data of the samples investigated
are summarised in Fig. 12. Based on fits of different data sets and fits with
different model options we estimate that the accuracy of the fast-component
lifetime, t1, is about ±2 ps, if not better.

Fig. 12: Decay
parameters of the samples investigated
Summary
Using the bh DCS-120 MP multiphoton FLIM
system, we were able to record fluorescence decay data of natural carotenoids
and anthocyanins. Although these compounds are often considered non-fluorescent
the system had no problem to record their decay functions and determine the
lifetimes. In all cases, the decay was dominated by an ultra-fast decay component,
with a lifetime in the range of 8.6 ps to 20 ps and an amplitude of
84% to 99%.
References
1.
W. Becker, Advanced time-correlated single-photon counting techniques. Springer,
Berlin, Heidelberg, New York, 2005
2.
W. Becker, The bh TCSPC handbook. 9th edition. Becker
& Hickl GmbH (2021), www.becker-hickl.com,
printed copies available from bh
3.
Becker & Hickl GmbH, The bh TCSPC Technique.
Principles and Applications. Available on www.becker-hickl.com.
4.
SPCImage NG Next Generation FLIM Data Analysis
Software. Overview brochure, available on www.becker-hickl.com
5.
Becker & Hickl GmbH, Sub-20ps IRF Width from
Hybrid Detectors and MCP-PMTs. Application note, available on
www.becker-hickl.com
6.
Becker & Hickl GmbH, DCS-120 Confocal and
Multiphoton FLIM Systems, user handbook, 9th ed. (2021). Available on
www.becker-hickl.com
7.
Becker & Hickl GmbH, Two-Photon FLIM with a
femtosecond fibre laser. Application note, available on www.becker-hickl.com
8.
W. Becker, Lukas Braun, A. Bergmann,
High-Resolution Measurement of NADH and FAD Fluorescence Decay with the DCS-120
MP. Application note (2021), available on www.becker-hickl.com
9.
W. Becker, J. Breffke, B. Korzh, M. Shaw, Q-Y.
Zhao, K. Berggren, 4.4 ps IRF width of TCSPC with an NbN Superconducting
Nanowire Single Photon Detector. Application note, available on www.beker-hick.com
10.
T. Bhatt, K. Patel, Carotenoids: Potent to
prevent diseases review. Natural Products and Bioprospecting 10:109-117 (2020)
11.
J. A. Fernández-López, V. Fernandez-Lledó, J. M.
Angosto, New insights into red plant pigments: more than just natural
colorants. RCS Adv. 20, 24669-24682 (2020)
12.
T. Gillbro, R.J. Cogdell, Carotinoid
Fluorescence. Chem. Phys. Lett. 158, 312-316 (1989)
13.
T. Maoka, Carotenoids as natural functional
pigments. Journal of Natural Medicines 74:1-16 (2020)
14.
D. Niedzwiedzki, J. F. Koscielecki, H. Cong, J.
O. Sullivan, G. N. Gibson, R. R. Birge, H. A. Frank, Ultrafast dynamics and excited
state spectra of open-chain carotenoids at room and low temperatures. J. Phys.
Chem. B 111, 5984-5998 (2007)
15.
H. Scheer, Pigmente und antennenkomplexe. In: D.-P. Häder (ed.),
Photosynthese. Georg Thieme Verlag, Stuttgart, New York. (1999)
16.
D. Schweitzer, S. Schenke, M. Hammer, F. Schweitzer, S. Jentsch,
E. Birckner, W. Becker, Towards metabolic mapping of the human retina. Micr. Res. Tech. 70, 403-409 (2007)
17.
J. Yabuzaki, Carotenoids Database: structures,
chemical fingerprints and distribution among organisms. Database, 2017, 111,
doi: 10.1093/database/bax004