Two-Photon FLIM with a Femtosecond Fibre Laser
Wolfgang Becker, Cornelia Junghans, Holger Netz,
Becker & Hickl GmbH
We
demonstrate two-photon FLIM with a femtosecond fibre laser. Our system consists
of a bh DCS-120 scanner attached to a Nikon TE microscope, a 785 nm Toptica
Femto Fibre Pro laser, HPM-100 hybrid detectors in a non-descanned beam
configuration, and a TCSPC FLIM system with two SPC-150NX TCSPC modules, a
GVD-120 scan controller, and a DCC-100 detector controller. We show that the
system is perfectly suited to record NADH FLIM data from cells and tissue. It
also records autofluorescence images from small organisms. FLIM images are also
obtained from stained specimens, such as the Invitrogen BPAE cell and mouse
kidney samples.
Motivation
Compared with the classic one-photon
excitation, two-photon excitation has a number of advantages. The excitation wavelength
is in the NIR, where direct absorption and scattering is lower than in the
visible or UV range. Therefore deeper layers in the sample can be reached. Due
to the nonlinearity of the two-photon process, excitation occurs preferentially
in the focus. Therefore, no pinhole is required to reject out-of-focus
fluorescence and scattered light. Consequently, the fluorescence light can be
diverted directly behind the microscope lens and sent to the detectors directly.
The principle is called 'non-descanned' detection, or NDD. The advantage is not
only that losses on the way back through the scanner optics are avoided. More
importantly, fluorescence photons which are scattered on the way out of the
sample can be collected efficiently and transferred to the detectors. Another
advantage is that fluorophores with short excitation wavelengths, such as NADH,
can be excited without the need of UV-optimised optics.
The ideal excitation source for two-photon
laser scanning microscopes is the titanium-sapphire (Ti:Sa) laser. It delivers
high power, short pulse width, and, most importantly, is tuneable in a range
from about 750 nm to 1000 nm. On the negative side, Ti:Sa lasers are
bulky, expensive, and need frequent maintenance.
In the last decade, more and more
femtosecond fibre lasers have become available. Fibre lasers are compact, less
expensive than Ti:Sa lasers, and don't need much maintenance. The pulse width
is on the orders of 100 fs, which is adequate for two-photon excitation in
a microscope. The concern against the fibre lasers is that the power may be
insufficient for two-photon excitation, and that they are not tuneable. We will
show that both concerns are not generally justified, and that a laser scanning
microscope with a fs fibre laser can be used for a wide range of applications.
DCS-120 MP System with Femtosecond Fibre Laser
To demonstrate the capabilities of
two-photon FLIM with fibre lasers we used our DCS-120 MP system [1]. The
optical part consists of a DCS-120 scan head, a Nikon TE 2000 microscope,
a Toptica 785 nm Femto Fibre Pro laser, and two HPM-100 hybrid detectors [2].
The principle is shown in Fig. 1. The laser delivers 120 mW of optical power at
a wavelength of 785 nm. The laser beam passes a shutter and a variable
attenuator. It is projected into the microscope by a DCS-120 scan head [1]. The
fluorescence light is collected back through the microscope lens, separated
from the excitation light by a dichroic beamsplitter in the filter carousel of
the microscope, and sent out through the back port of the microscope. It passes
a laser blocking filter and is split into two spectral components by a standard
microscopy beam splitter cube. Each spectral component is fed to a separate
detector via a bandpass filter. The signals are recorded by a standard dual-channel
bh SPC-150NX TCSPC system [2].
Fig. 1:
Optical principle of the 2-photon FLIM system
Results
NADH FLIM
With its 785 nm excitation wavelength
the system is perfectly adapted to FLIM of NAD(P)H in live systems. The
fluorescence decay function of NAD(P)H bears information on the metabolic state
of cells and tissues. The primary information is in the amplitudes of the fast
and slow decay component, as we have shown in [2]. These can only be obtained
by double-exponential analysis of the decay function. NADH FLIM therefore
requires efficient detection of the photons, recording of the entire decay
function at high time resolution [3], and efficient data analysis [2, 4]. This
is exactly what the bh FLIM systems are designed for [2].
NADH FLIM data of yeast cells are shown in Fig.
2. The data were acquired through a NA = 1.3 oil immersion lens and a
420 to 470 nm bandpass filter. A colour-coded image of the mean (amplitude
weighted) lifetime, tm, is shown on the left. The histogram of tm over pixels
is shown on the right. The decay curve in 5x5 pixel area around cursor position
is shown in the lower right.
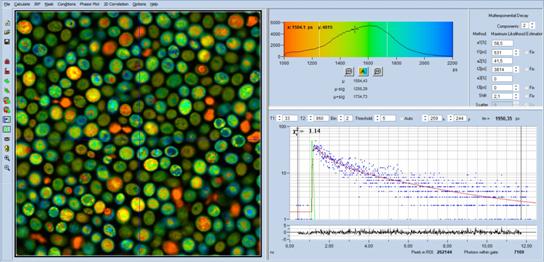
Fig. 2: FLIM data of yeast cells, data format 512 x 512 pixels,
1024 time channels. Analysis with SPCImage NG, double-exponential fit with MLE.
Left: Image of mean (amplitude weighted) lifetime, tm. Upper right: Histogram
of tm over pixels. Lower right: Decay curve in 5 x 5 pixel area around
cursor position.
The decay parameters, shown in the upper
right, are typical of NADH. The fast component (t1 = 631 ps) comes
from the free NADH, the slow component (T2 = 3914 ps) from the
bound NADH. The amplitude (a1 = 58.5 %) indicates a viable cell with
normal metabolism [2].
The quality of the decay data is high
enough to derive images of the individual decay components from the data. Images
of the component lifetimes, t1 and t2, and of the fast-component amplitude, a1,
are shown in Fig. 3.
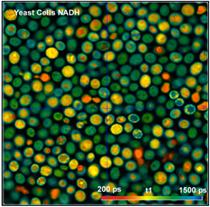
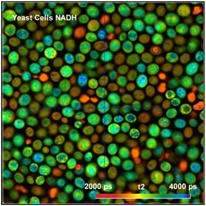
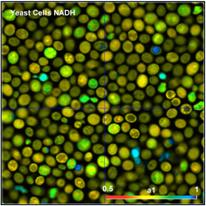
Fig. 3: Yeast cells. Left to right: Images of lifetime of fast decay
component, lifetime of slow decay component, and amplitude of fast component.
The data were acquired at a count rate of
300,000 photons per second (average over the entire image). The laser power was
about 6 mW. The acquisition time was 2 minutes. No change in the photon rate
was observed within this time. In principle, higher count rates (and thus
shorter acquisition times for the same number of photons) can easily be
obtained by increasing the excitation power. However, power in excess of 6 mW
quickly induces changes in the decay behaviour, and, finally, catastrophic
destruction of the cells. It should be noted that this is not a special feature
of FLIM or of the instrument described here. The limitation of the emission
rate is inherent to the sample itself, and a common problem in all
autofluorescence experiments.
Fig. 4 shows tm FLIM images of pig skin.
The images were acquired through the same filter as the yeast cells. An x20 NA
= 0.5 objective lens was used to obtain a large field of view. The FLIM data
format is 512 x 512 pixels, 1024 time channels.
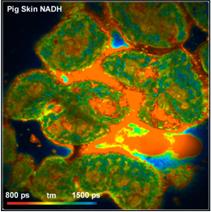
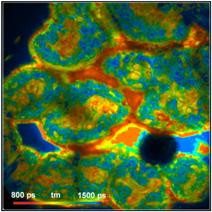
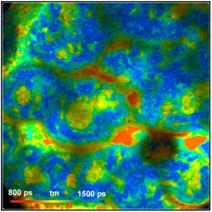
Fig. 4: Pig
Skin, through 420 to 470 nm filter. Different depth in tissue.
Amplitude-weighted lifetime of double-exponential decay
The images do not only contain fluorescence
from NADH but also from other tissue constituents, such as collagen. The laser
power was adjusted to obtain an average count rate of 1 MHz to 2 MHz over the
entire image. The laser power under these conditions was 4 mW to 6 mW, depending
on the depth in the tissue. Higher excitation power induces changes in the
sample, such as warp in spatial dimensions, a gradual decrease in the emission
intensity and a decrease in the average lifetime.
Autofluorescence FLIM of Small Organisms
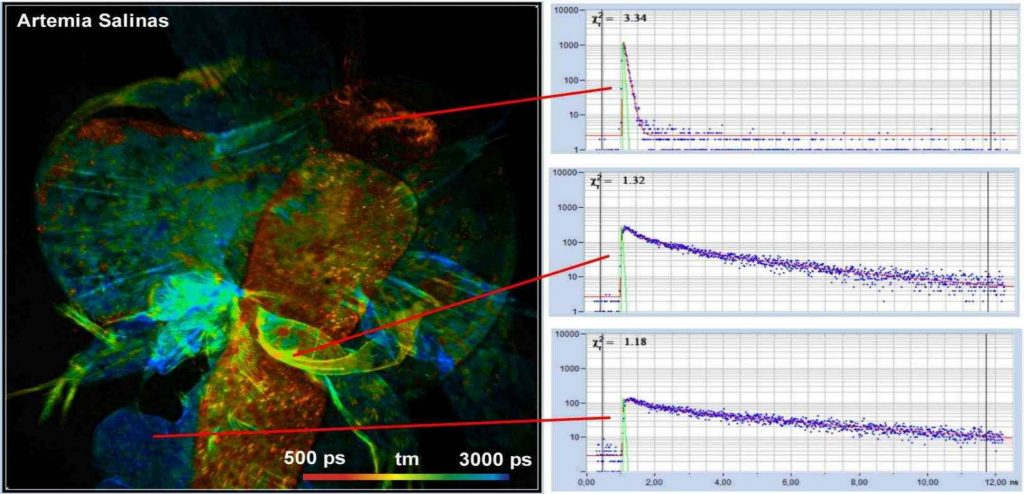
Fig. 5 shows a lifetime image of a brine
shrimp (artemia salinas). The image was recorded through an x20 NA = 0.5
microscope lens without a bandpass filter. The FLIM data format was
512 x 512 pixels, 1024 time channels. Fluorescence decay
functions of different areas are shown on the right. Because no bandpass filter
was used the data contain not only fluorescence but also SHG. SHG delivers
ultra-fast decay signals, as can be seen in the upper decay curve in Fig. 5.
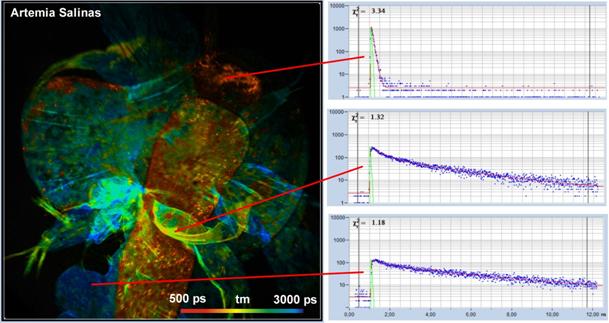
Fig. 5: Autofluorescence FLIM image of a brine shrimp, artemia salinas.
Mean (amplitude-weighted) lifetime of double-exponential decay. Decay functions
of selected areas shown on the right.
The excitation power for the acquisition of
the image shown in Fig. 5 was less than 4 mW. Despite the relatively low NA of
the objective lens and the correspondingly low collection efficiency, the
average count rate was more than 1 MHz.
FLIM of Samples with Exogenous Fluorophores
To show that the objections against
non-tuneable lasers are not generally justified we recorded a few FLIM images
of samples with exogenous fluorophores. Fig. 6, Fig. 7, and Fig. 8 show tm
images of the commonly used convallaria sample (stained with acridine orange),
of an Invitrogen BPEA Cell sample (Alexa 488), and of an Invitrogen mouse
kidney sample. All images have a FLIM format of 1024 x 1024 pixels, 1024
time channels. An objective lens of NA = 0.5 and x20 magnification was
used to obtain a wide field of view. Despite the relatively low NA strong
signals were obtained at a laser power of no more than 5 mW. This
indicates that a 785 nm fibre laser can be used for two-photon excitation
of a wide range of fluorophores.
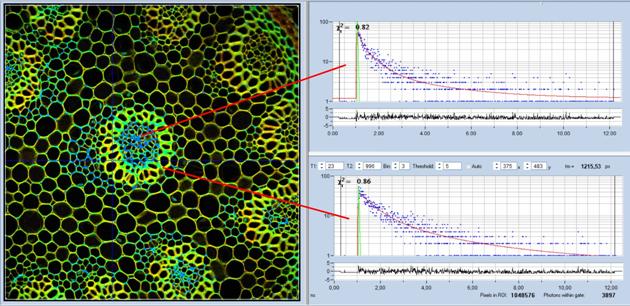
Fig. 6: Convallaria FLIM Image. 1024 x 1024 pixels, 1024 time channels.
Decay functions in two selected 5 x 5 pixel spots shown on the right.
Note the fast IRF (green curve), which is the result of the use of an
ultra-fast HPM-100-06 detector.
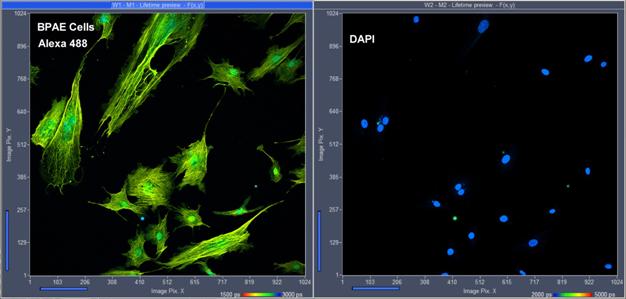
Fig. 7: Invitrogen BPAE cells, labelled with Alexa 488 and DAPI. FLIM
format 1024 x 1024 pixels, 1024 time channels. Parallel detection in
two channels, emission filters for Alexa 488 and DAPI. Lifetime-image display
of SPCM data acquisition software.
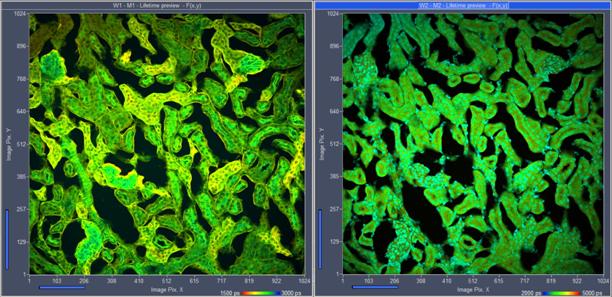
Fig. 8: Invitrogen mouse kidney sample, labelled with Alexa 488 WGA, Alexa
568-Phalloidin und DAPI . FLIM format 1024 x 1024 pixels, 1024 time channels.
Parallel detection in two channels, emission filters 510 to 570 nm and 410 to
460 nm.
Summary
The 2p FLIM system presented in this
application note is a simple and cost-efficient alternative to a complex
Ti:Sa-based multiphoton microscope. This is especially the case if the primary
application is metabolic imaging. With 785 nm excitation wavelength, the
system is ideally suited for NAD(P)H FLIM. The system features extraordinarily
high detection efficiency and time resolution. It provides high-quality decay
data suitable for double-exponential decay analysis. It is thus capable of
recording the metabolic state of cells and tissues via analysis of the
amplitudes of the bound and unbound NADH components. Additionally, the system
is excellently suited for recording autofluorescence FLIM from small organisms.
Despite the fixed excitation wavelength the system also records FLIM from a
large number of samples with exogenous fluorophores. The available excitation
power is absolutely sufficient for all these applications. All FLIM images
presented in this application note were recorded with no more than 6 mW in
the sample plane. Higher power was not only unnecessary, but even caused
destructive effects in the samples. For comparison, the laser delivers
120 mW, 40 mW of which arrive in the sample plane. Thus, there is
plenty of power reserve either to destroy the sample or to record images from
weakly fluorescent samples and deep sample layers.
References
1.
Becker & Hickl GmbH, DCS-120 Confocal and
Multiphoton Scanning FLIM Systems, user handbook 8th ed. (2019). Available on
www.becker-hickl.com
2.
W. Becker, The bh TCSPC handbook. 8th edition (2019),
available on www.becker-hickl.com
3.
Ultra-fast HPM Detectors Improve NAD(P)H FLIM.
Application note, available on www.becker-hickl.com
4.
SPCImage NG data analysis software. Overview
brochure, available on www.becker-hickl.com