Ultra-Fast
Fluorescence Decay in Scottish Whisky
Wolfgang Becker, Julius Heitz, Axel Bergmann
Becker
& Hickl GmbH, Berlin, Germany
Abstract: Using TCSPC with ultra-fast hybrid
detectors we found extremely fast fluorescence-decay components in Scottish whisky.
Already cuvette based fluorescence measurements with picosecond-diode laser
excitation showed that the decay functions contained components with lifetimes shorter
than 50 ps. The relatively large width of the laser pulses and the transit
time in the cuvette resulted in an IRF width of about 75 ps. Due to
uncertainty in the IRF the component lifetimes could not be determined more
accurately. We therefore used our DCS-120 MP multiphoton FLIM system to obtain
fluorescence decay data at higher temporal resolution. Negligible excitation
pulse width of the femtosecond laser, small effective sample volume, and
absence of transit-time effects in the sample lead to an IRF width of about 25 ps.
Data obtained with this system showed fast decay components down to less than
10 ps decay time and more than 90% amplitude. Decay times and amplitudes
were clearly different for different whisky samples. Whether the values are characteristic
of the brand or of the ageing we are not able to tell.
Cuvette-Based Measurements
For the cuvette measurements we used the normal
90° configuration [1]. The collimated laser beam of a bh BDS-SM 405 nm
picosecond diode laser entered the cuvette from one side. The laser power was
about 1 mW, the pulse repetition rate 50 MHz. The light leaving the cuvette
under 90° was detected by a HPM-100-06 hybrid detector [3]. Scattered
excitation light was blocked by a 420 nm long-pass filter. The light was delivered
directly, without a lens, to the active area of the detector. The
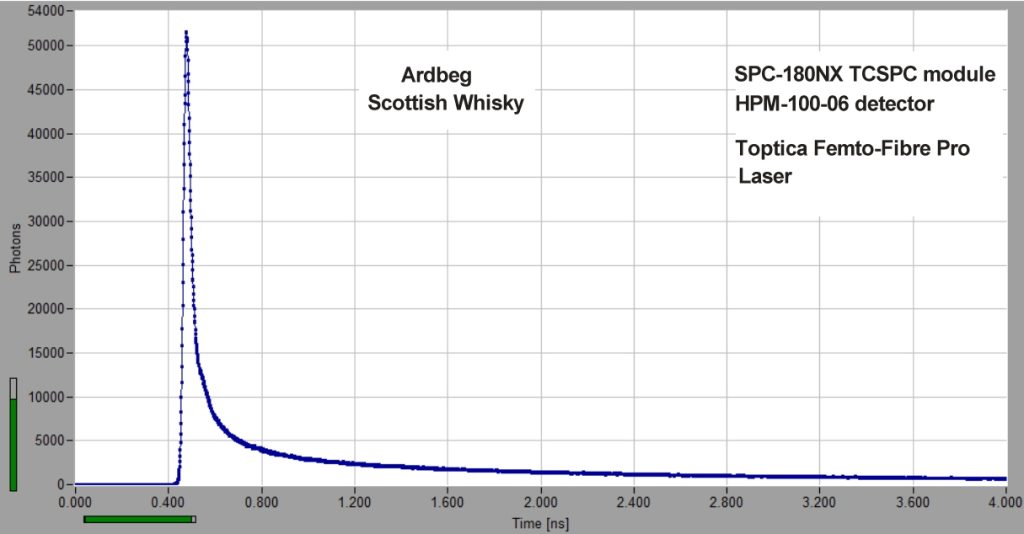
fluorescence-decay data were recorded by an SPC-150NX TCSPC module [1]. The
number of time channels was 4096, the time per channel 1.22 ps. Decay
curves recorded with this setup are shown in Fig. 1.
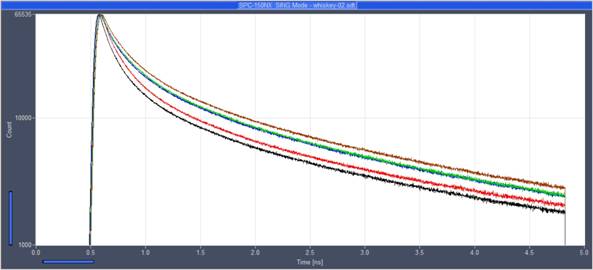
Fig. 1: Decay curve of different brands of whisky. Green, blue, red are
Scotch, brown is an Irish, black is a Kentucky.
The blue, green and red curves were
obtained from Jura, Ardbeg, and Lagavulin, respectively. For comparison, the
brown curve shows an Irish whisky (Jameson), and the black curve a Kentucky
whiskey (Seven Oaks). The general shape of the decay curves is the same for all
brands. The decay is multi-exponential, but can be reasonably fit with three exponentials.
Differences between the brands appear to be more in the amplitudes of the
components than in the lifetimes.
Fig. 2 shows a triple-exponential fit of
the green decay curve (Ardbeg). The decay time for the fastest component, t1,
comes out with 32 picoseconds, the amplitude with 67.6 %. It should be noted
however, that t1 strongly depends on the width and the shape of the IRF.
Unfortunately, the effective IRF in a cuvette-based system is poorly defined.
It contains a component from the transit time of the laser pulse through the
cuvette. For a 1-cm cuvette it is about 50 ps. This value changes,
however, if a significant part of the laser power is absorbed. The fluorescence
intensity is then different for different points along the laser beam path. Even
an accurately measured IRF therefore does not necessarily represent the
effective IRF of the fluorescence measurement. We therefore refused to measure
an IRF and instead used the synthetic IRF of SPCImage NG [5], see green curve
in Fig. 2. The best fit was obtained with an IRF of 74 ps width. The
lifetime of the fast component, t1, is then 32 ps. However, with slightly
different values of the IRF width almost any lifetime of the fast component from
40 ps down to 10 ps can be obtained.
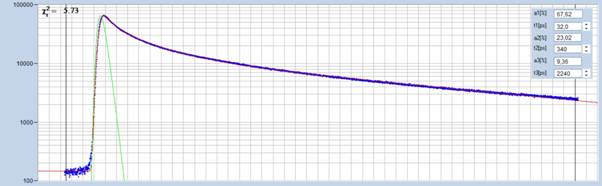
Fig. 2: Triple-exponential fit with SPCImage NG [5], measured in cuvette
setup. Decay data from Ardbeg, green curve in Fig. 1. Decay curve shown blue,
IRF green, fit with model function red. Horizontal axis 0 to 5 ns, 100 ps
per division. The fastest component, t1, comes out with a lifetime of 32 ps and
an amplitude of 67.6 %.
Two-Photon FLIM Measurements
For two-photon excited decay measurement we
used the bh DCS-120 MP multiphoton FLIM system [2, 4]. A Toptica Femto-Fibre
Pro laser was used as an excitation source. The laser delivers pulses of about
120 fs width at a repetition rate of 40 MHz. The laser delivers about
150 mW. Whisky samples were filled into standard cell dishes and imaged by
the normal FLIM process [2]. The fluorescence light was detected by an HPM-100-06
hybrid detector via the non-descanned beam path of the FLIM system. An SP700
short pass filter blocked the excitation wavelength, possible SHG light was
blocked by an LP420 nm long-pass filter. The laser power in the sample
plane was reduced to 10 mW by the attenuator wheel of the DCS-120 scanner.
Decay data were acquired by scanning the
samples with a frame format of 128 x 128 pixels, and a frame time of
0.4 seconds. In comparison to single-point measurement scanning produces larger
data files but avoids temperature changes by the injected laser power. The
decay data were recorded in 4096 time channels, into an observation-time
interval of 5 ns, and with a time-channel width of 1.22 ps. The
recorded data were analysed with SPCImage NG. Within the scan area, an ROI was
selected which contained about 1 million photons. The decay data of the pixels
within the ROI were combined into a single curve, which was then used for
determination of the decay parameters.
A triple-exponential decay model was used
to fit the data. Moreover, a synthetic IRF was generated by the IRF-modelling
function of SPCImage NG [5]. IRF modelling delivered an IRF width of
24 ps, which is in good agreement with the values obtained in previous
experiments [6, 7]. The IRF is not quite as fast as the IRF obtained with
direct laser illumination of the detector (19 ps) [3]. We believe that the
difference is due to transit-time differences in the NDD beam path. The optical
path contains spherical lenses with short focal length. Spherical aberration of
these lenses causes path length differences on the order of 1 mm from the
centre of the beam path to the edge. 1 mm path length difference in water translates
into 5 ps timing spread , which explains the differences in the IRF
widths.
A decay curve obtained from Ardbeg whisky is
shown in Fig. 3. The blue curve is the fluorescence decay, the green curve is
the IRF, and the red curve is the model function. Residuals are shown at the
bottom. Decay parameters are shown in the upper right. The decay function is
dominated by an extremely fast decay component. A fit with a triple-exponential
decay model delivers a fast decay component, t1, with a decay time of
9.2 ps, and an amplitude of 91.2 %. The amplitude-weighted mean lifetime
is 55 ps.
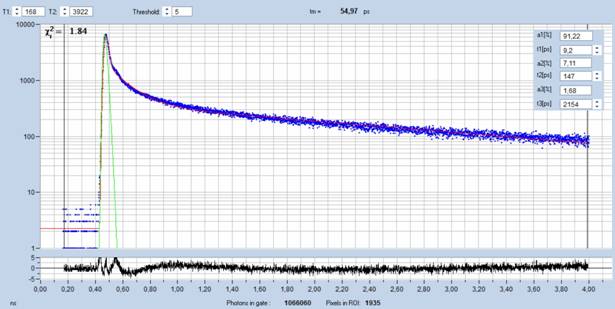
Fig. 3: Two-photon decay curve of Ardbeg Scottish whisky. The fluorescence
decay curve is shown blue, the IRF green, and the model function red. The decay
parameters are show upper right. The fast decay component, t1, has a lifetime
of 9.2 ps and an amplitude of 91.2 %.
A comparison of the decay data of the different
brands of whisky is given in Fig. 4. Visibly, the curves appear more or less
'steep', indicating that the major difference is in the fast decay component.
The decay parameters confirm this: a1 decreases and t1 increases from Ardberg
and Jura over McIntyre, Seven Oaks, Lagavulin, to Jameson. Because the decay is
dominated by the fast component, also the amplitude-weighted mean lifetime, tm,
follows the same tendency.
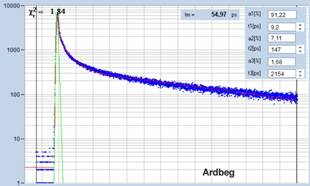
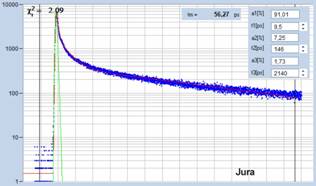
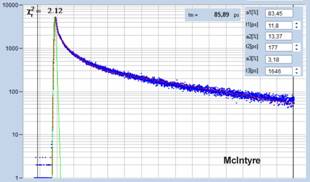
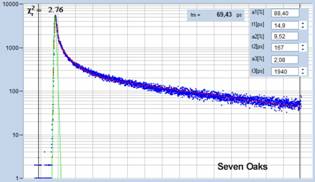
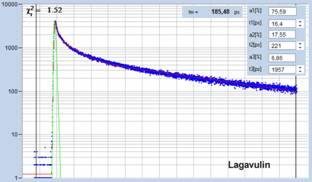
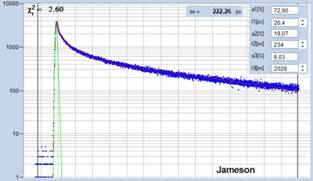
Fig. 4: Decay curves and decay parameters for 6 different brands of Whisky.
Two-photon excitation at 780 nm, HPM-100-06 hybrid detector.
Summary
We used two-photon excitation with a
femtosecond laser in combination with ultra-fast TCSPC FLIM to record
fluorescence-decay functions in Scottish whisky. Due to the fast IRF of the
system we were able to detect fluorescence-decay components down to lifetimes
of less than 10 ps. The fast decay appears with an amplitude of up to 91 %
and thus dominates the net fluorescence decay. Different brands of whisky noticeably
differ in their fluorescence-decay behaviour. The differences are mainly in the
lifetime and the amplitude of the fast decay component. Whether this is a
result of the manufacturing process, the ageing, or the material of the barrels
in which the whisky is stored, and whether the decay parameters are specific of
the different manufacturers we do not know. More data are required to find that
out. Whisky friends are welcome to send us their samples.
The most important result of this
investigation is probably the confirmation that ultra-fast fluorescence-decay
processes [6, 7, 8] are by far more frequent than commonly believed. Ultra-fast
decay times should therefore no longer be considered a peculiarity but a real
source of scientific information.
References
1. W. Becker, The bh TCSPC handbook. 9th edition (2021), available on
www.becker-hickl.com
2. Becker & Hickl GmbH, DCS-120 Confocal and Multiphoton Scanning FLIM
Systems, user handbook 9th ed. (2021). Available on www.becker-hickl.com
3.
Sub-20ps IRF Width from Hybrid Detectors and
MCP-PMTs. Application note, available on www.becker-hickl.com
4. Becker & Hickl GmbH, Two-Photon FLIM with a femtosecond fibre laser.
Application note, available on www.becker-hickl.com
5. Becker & Hickl GmbH, SPCImage Next Generation FLIM data analysis
software. Overview brochure, available on www.becker-hickl.com
6. W. Becker, C. Junghans, A. Bergmann, Two-photon FLIM of mushroom
spores reveals ultra-fast decay component. Application note, Becker & Hickl
GmbH, available on www. becker-hickl.com
7. Wolfgang Becker, Taravat Saeb-Gilani, Cornelia Junghans, Two-Photon
FLIM of Pollen Grains Reveals Ultra-Fast Decay Component. Application note,
Becker & Hickl GmbH, available on www. becker-hickl.com
8. Wolfgang Becker, V. Shcheslavskiy, Axel Bergmann, FLIM at a
Time-Channel Width of 300 Femtoseconds. Application note, Becker & Hickl
GmbH, available on www. becker-hickl.com