Principles
Fluorescence Cross Correlation (FCCS)
Fluorescence Cross Correlation, or FCCS, correlates intensity fluctuations in one wavelength interval versus another. The main application is the study of protein interaction. By attaching fluorophores of different emission spectra to different protein structures and measuring the cross correlation of the intensity fluctuations it can be found out whether the proteins are bound to each other or not.
As single-wavelength FCS, FCCS requires a femtoliter detection volume. The fluorescence signal is split in two spectral components, the photons are detected by two detectors, and processed either via two parallel TCSPC modules, in two channels of a bh DPC-230 correlator, or via a router attached to a single TCSPC module. The first architecture is preferred in systems which are also used for FLIM because it allows the system to process a high photon rate and provides high FLIM time resolution. The optical principle is shown in the figure below. In some cases a second laser has to be used to excite the second fluorophore. However, usually fluorophores can be found that can be excited at the same wavelength.
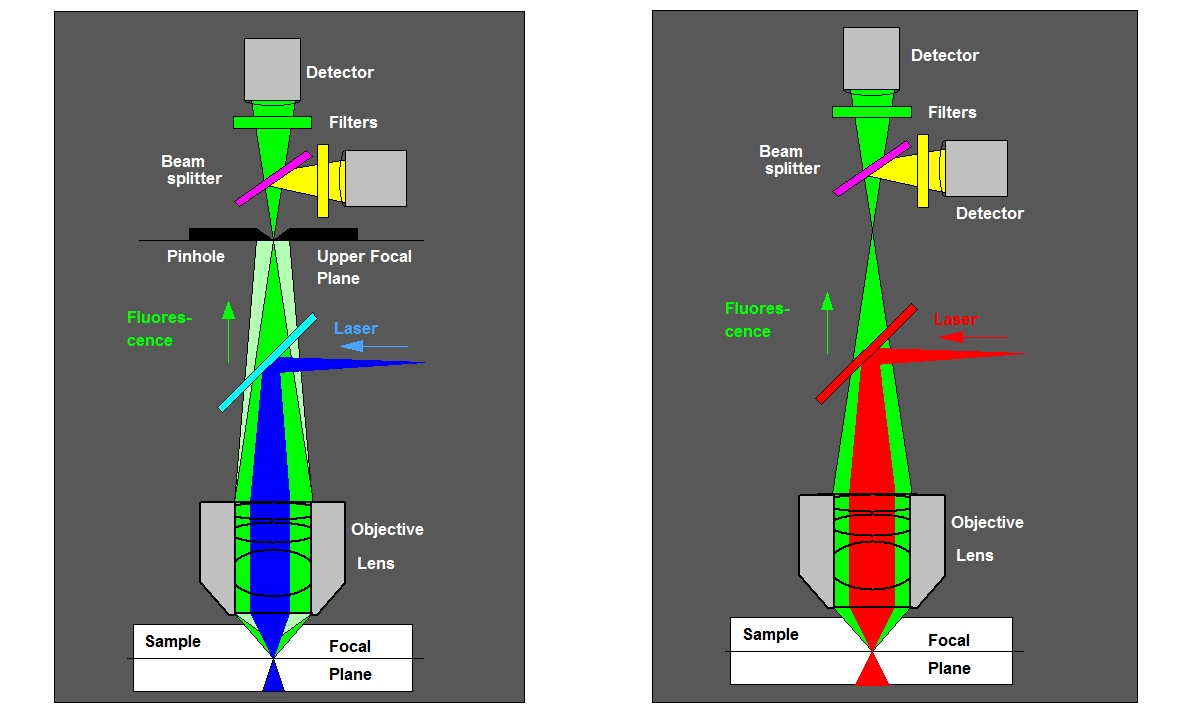
Left: FCCS with one-photon excitation and confocal detection. A pinhole in the upper focal plane of the microscope suppresses light from outside the focal plane, the light is split into two detection channels. Right: FCS with Two-photon excitation. Excitation occurs only in the focus of the laser so that no pinhole is required.
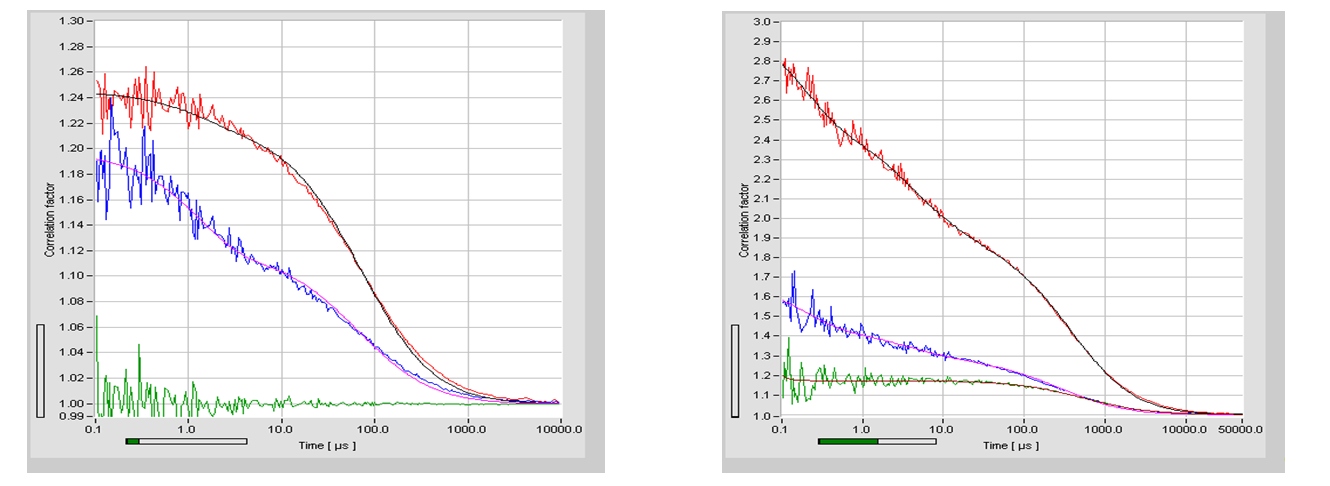
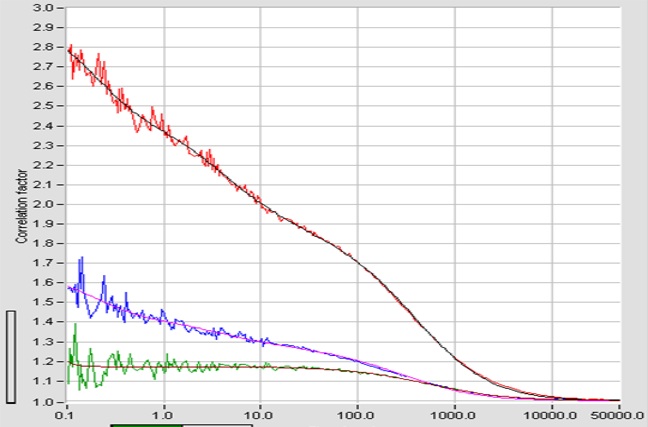
For correlation algorithm is similar to the FCS algorithm, except for the fact that that photons of different channels are correlated. Please see bh TCSPC Handbook, chapter ‘Fluorescence Correlation Spectroscopy’. FCCS curves recorded with a DCS-120 confocal FLIM system are shown in the figure below.