Principles
Table of Contents
- Fluorescence Correlation Spectroscopy (FCS) – How it Works in Microscopy
- The Power of Fluorescence Correlation Spectroscopy with TCSPC Module and SPCM Softwarey
- Enhance Your FCS with Time Gating: Example Figure
Fluorescence Correlation Spectroscopy (FCS) – How it Works in Microscopy
Fluorescence correlation spectroscopy (FCS) is based on exciting a small number of molecules in a femtoliter volume, detecting the fluorescence photons, and correlating the fluctuations of the fluorescence intensity. The fluctuations are caused by diffusion, rotation, intersystem crossing, conformational changes, or other random effects. The technique dates back to a work of Magde, Elson and Webb published in 1972.
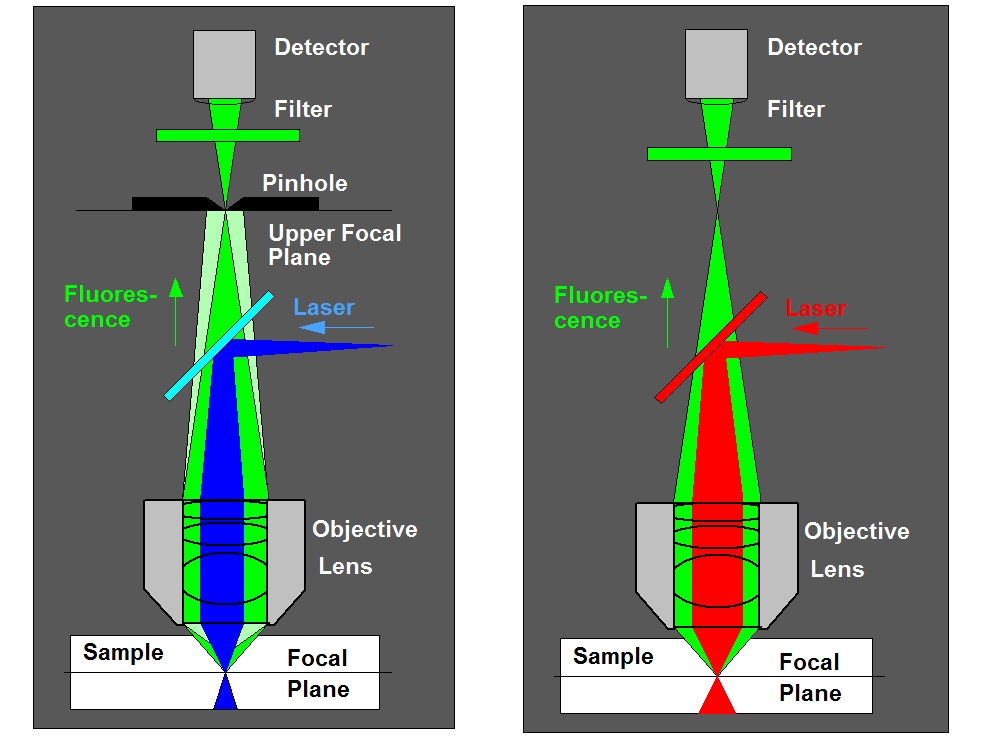
The required femtoliter detection volume can only be achieved in the focus of a high-NA microscope lens. Therefore FCS measurements must be performed in a microscope or a similar optical setup. Excitation and detection from a sufficiently small volume can be achieved by confocal detection or by two-photon excitation. The principle is the same as in a laser scanning microscope, see figure below.
The Power of Fluorescence Correlation Spectroscopy with TCSPC Modules and SPCM Software
The single-photon pulses from the detector are recorded by a TCSPC Module in the FIFO (parameter-tag) mode. In setups with several detectors the photon pulses of the detectors are either connected to a single TCSP module via a router or to separate TCSPC modules. The correlation functions are calculated online by the SPCM software. For correlation algorithms please see bh TCSPC Handbook, chapter ‘Fluorescence Correlation Spectroscopy’.
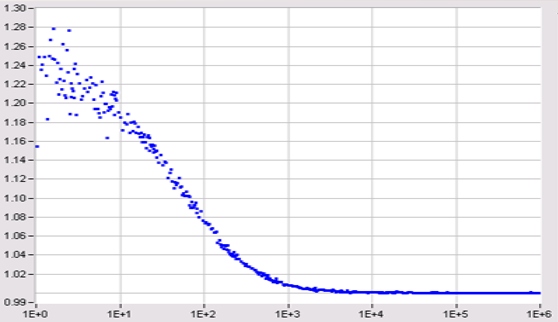
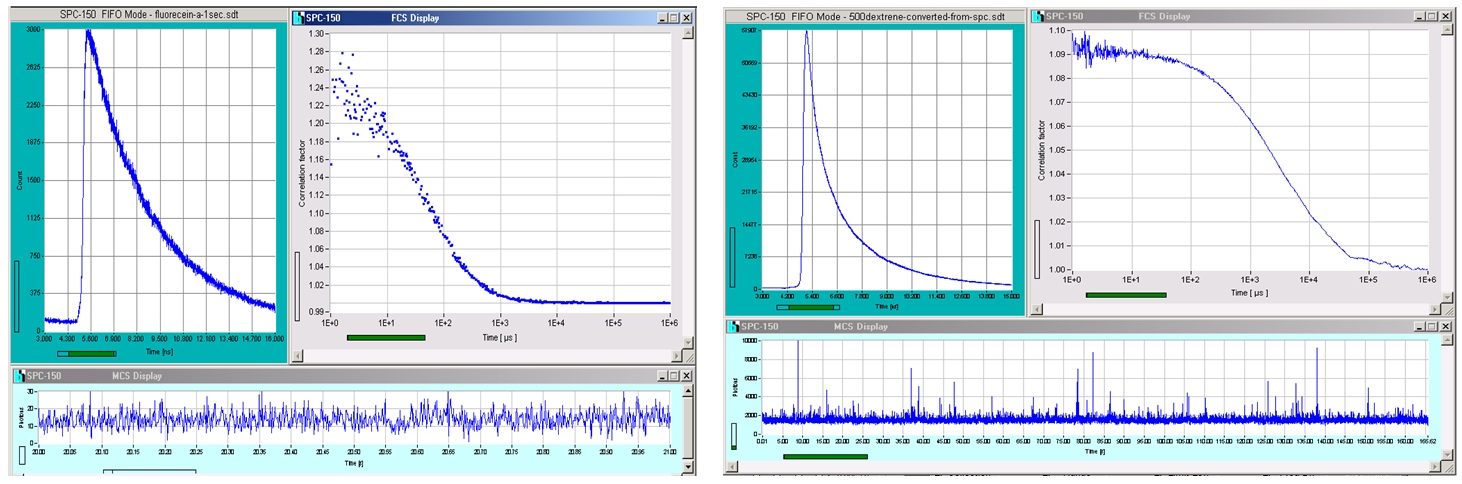
FCS curves recorded with a bh SPC-150 module integrated in a DCS-120 confocal FLIM system are shown in the figure below. A ps diode laser was used for excitation, therefore a fluorescence decay curve is obtained simultaneously with the FCS curve. The figure shows the main panel of the SPCM software in a typical FCS configuration. The decay curves are displayed on the left and the FCS curve on the right. An intensity trace showing the fluctuations is displayed at the bottom. For procedures and parameter setup please see handbook ‘DCS-120 Confocal and Multiphoton FLIM Systems‘.
Enhance Your FCS with Time Gating: Example Figure
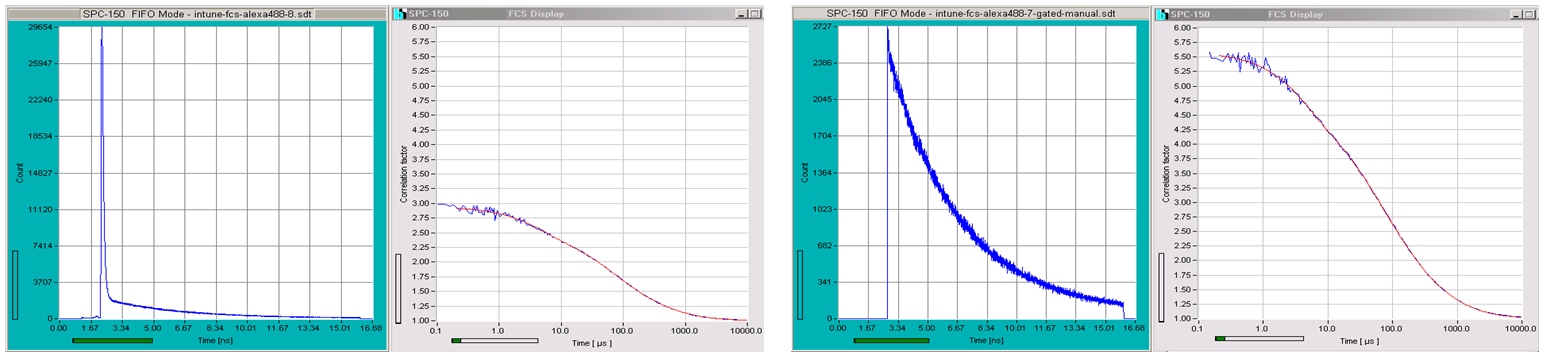
The fact that TCSPC data contain both the macro times (absolute times) and the micro times (times after the laser pulses) of the photons can be used to time-gate the FCS recording. Time gating is helpful when the fluorescence signal from the fluorescing molecules is contaminated by Raman scattering from the solvent. An example is shown in the next figure. The data shown left contain the Raman peak, the data shown right have the Raman peak gated off. The result is a substantial increase in FCS amplitude because the gated signal does not contain a the Raman signal.
For more information, related applications and references, please see: The bh TCSPC Handbook, chapter ‘Fluorescence Correlation Spectroscopy’