An AFM/NSOM System with Fluorescence Lifetime Imaging
Wolfgang Becker, Vladislav Shcheslavskiy, Becker & Hickl GmbH
Abstract: We present the integration of fluorescence lifetime imaging (FLIM)
into an atomic force microscope (AFM). The system is based on the NTEGRA
SPECTRA AFM/NSOM system of NT-MDT, Moscow, and a Simple-Tau 150 TCSPC FLIM
system of Becker & Hickl, Berlin. We demonstrate that the integrated system
is able to record combined AFM / FLIM images of E-coli bacteria, HEK cells,
and polymers.
Introduction
Since their broad introduction in the early
90s confocal and two-photon laser scanning microscopes have initiated a
breakthrough in imaging. The applicability of multi-photon excitation, the
optical sectioning capability and the superior contrast of these instruments
make them an ideal choice for fluorescence imaging of biological samples.
The fluorescence of organic molecules is
not only characterised by the emission spectrum, it has also a characteristic
lifetime. Any energy transfer between an excited molecule and its environment
in a predictable way changes the fluorescence lifetime. Since the lifetime does
not depend on the concentration of the chromophore fluorescence lifetime
imaging is a direct approach to all effects that involve energy transfer.
Typical examples are the mapping of cell parameters such as pH, ion
concentrations or oxygen saturation by fluorescence quenching, or fluorescence
resonance energy transfer (FRET) between different chromophores in the cell [1].
Furthermore, combined intensity/lifetime
imaging is a powerful tool to distinguish between different fluorescence
markers in multi-stained samples and between different natural fluorophores of
the cells themselves. These components often have ill-defined fluorescence
spectra but are clearly distinguished by their fluorescence lifetime.
However, while confocal FLIM provides a
significant amount of chemical information on the sample, its spatial
resolution is diffraction limited. Therefore, it would be natural to combine
FLIM with another high-resolution microscopy technique. One of the relatively
new and established techniques for topographical imaging of both biological and
inorganic samples at nanoscale resolution is atomic force microscopy (AFM). AFM
has several modes of operation (contact, tapping and non-contact). One of the
most developed modes of AFM for biology applications is a tapping mode: that
is when the tip is oscillated at its resonance frequency, and the force applied
by the tip is quite low to enable imaging of soft biological structures with
ultrahigh resolution. The label-free topographical,
electrical, magnetic and mechanical information that can be obtained from the
AFM correlated with the fluorescence lifetime map provides an important tool
for deeper investigation of a sample properties.
System description
AFM / NSOM System
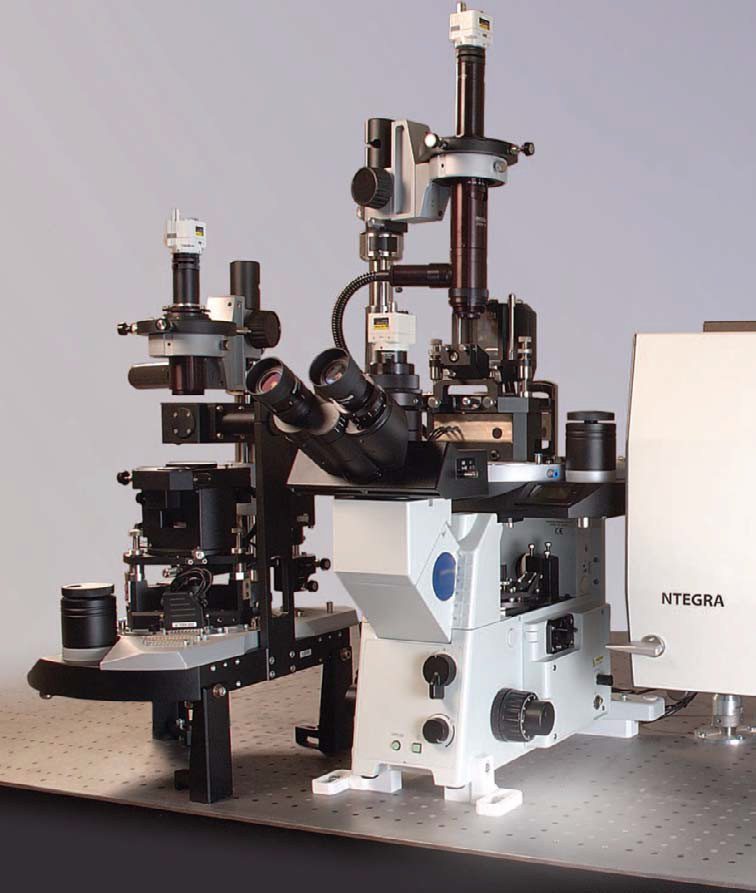
A photo of the NTEGRA SPECTRA system is
shown in Fig. 1, left, the sample excitation principle in Fig. 1, right.
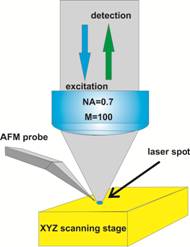
Fig. 1: Left:
Photo of NTEGRA SPECTRA system. Right: Operation
principle of the AFM head with built-in objective lens
The system works in the AFM tapping mode. The
fluorescence is collected back though the microscope lens and projected into a
confocal pinhole. Light passing the pinhole is spectrally filtered by a
monochromator in the NTEGRA optics, and projected on the FLIM detector. The
configuration used in the NTEGRA system and a special AFM probe shape have the
advantage that it can be used also for opaque samples. Moreover, it can be used
to perform beam scanning in addition to sample scanning, which is a welcome
feature for co-localisation measurements and for measurements with enhanced
Raman scattering [8].
For AFM and FLIM imaging, the sample is
placed on a three-axis piezo stage (Fig. 1, right). The piezo stage is used
both for keeping the AFM probe at a constant distance to the sample surface,
and for raster scanning in x and y. The piezo stage has a scan area of 120µm x
120µm in X and Y, and a scan range of 10µm in Z. All the images presented here
were collected with a tapping mode AFM silicon cantilever coated with TiN. The
length of the cantilever was 125µm. The probe had a force constant of 5.1N/m, compatible
with imaging of biological objects, and a resonant frequency of 160 kHz.
FLIM System
For fluorescence lifetime imaging, the
system was upgraded with a bh BDL‑SMN 488 nm picosecond diode laser
[2], a bh Simple-Tau 150 TCSPC FLIM system [1], and a bh HPM‑100-40 GaAsP
hybrid detector [1, 3]. The system components are shown in Fig. 2.
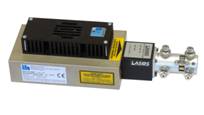
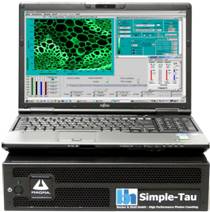
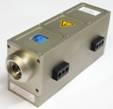
Fig. 2: Components of the FLIM system. Left to right: BDL‑SMN ps
diode laser, Simple-Tau 150 TCSPC FLIM system, HPM‑100-40 hybrid
detector.
The BDL‑SMC laser generates pulses of
488 nm wavelength, 50 ps pulse duration, and 80, 50, or 20 MHz repetition
rate. The laser has a beam-profile corrector and a Qioptiq single-mode fibre
connector. The power injected into the fibre is about 2 mW at 80 MHz.
Higher power is available if an increase of the pulse duration is acceptable [2].
The Simple-Tau 150 consists of a
laptop computer with a bus extension cable and an electronics box. The box
contains a bh SPC‑150 TCSPC/FLIM module and a DCC‑100 detector controller.
The HPM‑100 detector contains a Hamamatsu R10467-40 hybrid PMT tube, the
high-voltage generators for the operating voltages of the tube, and a GHz-bandwidth
low-noise preamplifier. The detector has a detection efficiency of about 50%
and is free of afterpulsing. The result is a very good photon efficiency of the
FLIM measurement: The number of photons required to reach a given lifetime
accuracy is very close to the ideal value [1].
Fluorescence lifetime imaging in the SPC‑150
TCSPC card is based on a multi-dimensional TCSPC process [1]. The principle is
shown in Fig. 3, left, the general system architecture in Fig. 3, right. The
TCSPC module receives the single-photon pulses from the detector, the timing
reference pulses from the laser, and the scan synchronisation pulses
(start-of-frame, start-of-line, start-of-pixel) from the scan controller of the
NTEGRA system. For every photon, the TCSPC system determines the time, t, in
the laser pulse period, and the location (x, y, of the AFM tip) in the scan
area. From these pieces of information, the TCSPC process builds up a photon
distribution over x, y, and t. The distribution can be interpreted as an array
of pixels over x and y, each containing a full fluorescence decay function over
the time in the pulse period, t. The advantage of the process is that it
records a full fluorescence decay function in each pixel, not only a
fluorescence lifetime. Moreover, it records at near-ideal photon efficiency,
and it can be used at any scan rate. In laser scanning microscopes (with scan
rates on the order of 106 pixels per second) the acquisition is run
over a larger number of frames. At the slow scan rates used in AFM / NSOM the
data are usually acquired over a single frame. The result is independent of the
scan rate if the total acquisition time and the detection rate are the same [1].
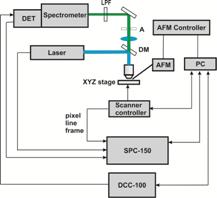
Fig. 3: Left: Principle of TCSPC FLIM. Right: Schematic
diagram of the AFM-FLIM setup. LPF: long-pass filter (495LP), DM: dichroic
mirror 510lpxru, DET: HPM-100-40 hybrid detector.
The SPC‑150 module in combination
with bh 64 bit SPCM data acquisition software is able to record images of
megapixel size [1, 4]. This makes the FLIM system compatible with the high
pixel numbers frequently used in AFM. Frames sizes of 2048 x 2048
pixels, 1024 x 1024 pixels, and 512 x 512 pixels are possible at
a time resolution of 256, 1024, and 4096 time channels per pixel, respectively
[1]. The high number of time channels can be useful when NSOM decay data
contain both very fast and very slow decay components.
All data presented here were recorded by
the procedure described above, and in the FIFO Imaging mode of the SPCM data
acquisition software. FLIM data analysis was performed by bh SPCImage FLIM data
processing software [1]. FLIM data were combined with AFM topography data by
using NOVA software of NT-MDT.
Sample Preparation
The preparation of the samples for AFM is
essentially the same as for normal FLIM measurements, apart from the fact that
the samples should not be covered with a cover slip that would prevent access
of the AFM probe to the surface of the sample.
Results
E-coli bacteria transfected with EGFP and phiYFPv
E-coli bacteria were
transfected with EGFP and phiYFPv. The cell suspension was deposited on the glass
slide and dried. Both height and phase (not shown) images were acquired and
further processed with NOVA software. Fig. 4, A, shows a topography image
(512x512pixels) of a relatively dense population of e-coli bacterial cells. The
overall scanning range is 40x40µm. Fig. 4, B to D shows a 4x4 µm area in the
same data. Fig. 4, C, is the FLIM image, Fig. 4, D, is an overlay of the
fluorescence lifetime with the topography data. A fluorescence decay function
in a 5x5 pixel area of Fig. 4, C, is shown in Fig.
5.
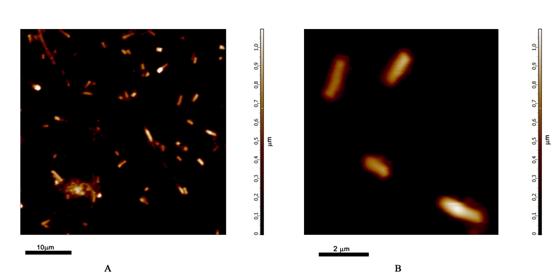
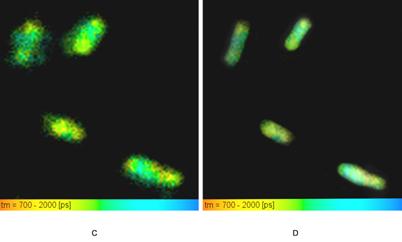
Fig. 4: E-coli bacteria transfected
with EGFP and phiYFPv. A: AFM (topography) data, scan area 40x40 µm. B: AFM
(topography) data, scan area 4x4 µm. C: NSOM FLIM, colour = fluorescence
lifetime, brightness = fluorescence intensity, scan area 4x4 µm. D: AFM / FLIM,
colour = fluorescence lifetime, height of topography = brightness, scan area
4x4 µm.

Fig. 5:
Fluorescence decay function in a 5x5 pixel area of the lower right cell in Fig. 4, C.
HEK cell transfected with GFP
Fig. 6 shows data recorded at a HEK (human
embryonic kidney) cell. Left to right, it shows the AFM topography image, the
lifetime images, and a combined lifetime-topography image.
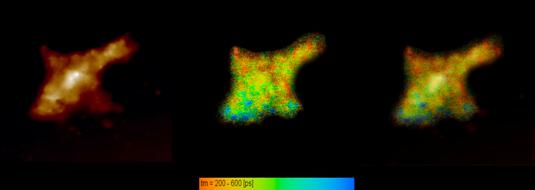
Fig. 6: HEK (human embryonic kidney) cell. Left: Topography. Middle:
Lifetime, red to blue represents 200-600 ps. Right: Lifetime (colour)
combined with topography (brightness)
Polymer
Fig. 7, left to right, shows a topography
image, a lifetime image, and the combined topography-lifetime image of a
polymer blend. Fig. 8 shows the fluorescence decay function in a 3x3 pixel area
of the bright feature on the lower right of Fig. 7.
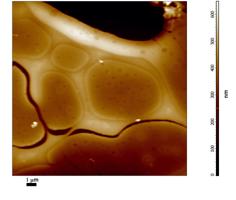
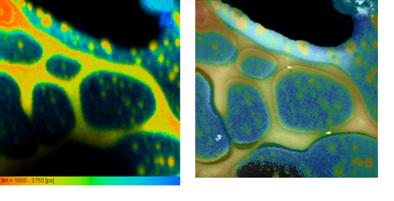
Fig. 7: NSOM
FLIM of a polymer blend. Left to right: Topography, lifetime image, Lifetime
combined with topography.
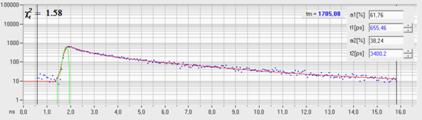
Fig. 8:
Fluorescence decay function in a 3x3 pixel area of the bright feature on the
lower right of Fig. 7.
Summary
AFM/NSOM systems can easily be combined
with bh FLIM systems if they provide an output for the synchroninisation
pulses, new-frame, new-line, new-pixel from the piezo controller, an optical
input from a pulsed laser, and an optical output to a photon counting detector.
These requirements are met by the NT-MDT NTEGRA system. We tested a combination
of the NTEGRA with a bh Simple-Tau 150 TCSPC FLIM system, a bh BDL-SMN ps
diode laser, and a bh PMH-100-40 hybrid detector. The advantage of AFM FLIM is
that both high-resolution topography data and fluorescence lifetime data are
obtained. The data can be combined into images that show the topography as
brightness and the fluorescence lifetime as colour. Results were presented for
E Coli cells, HEK cells, and a polymer blend. The technique described can be
extended to combined fluorescence/phosphorescence lifetime imaging [5], laser wavelength multiplexing [1], multi-wavelength detection [1, 6], and NIR detection [7].
References
1. W. Becker, The bh TCSPC handbook. Becker & Hickl GmbH, 6th
Edition (2015), www.becker-hickl.com, printed copies available from bh
2.
Becker & Hickl GmbH, BDL-SMN series
picosecond diode lasers. User handbook, www.becker-hickl.com
3. Becker, W., Su, B., Weisshart, K. & Holub, O. (2011) FLIM and
FCS Detection in Laser-Scanning Microscopes: Increased Efficiency by GaAsP
Hybrid Detectors. Micr. Res. Tech. 74, 804-811
4.
Studier, H., Becker, W. Megapixel FLIM. Proc.
SPIE 8948, (2014)
5. Becker, W., Su, B., Bergmann, A., Weisshart, K. & Holub, O. (2011) Simultaneous
Fluorescence and Phosphorescence Lifetime Imaging. Proc. SPIE 7903, 790320
6.
Becker & Hickl GmbH,
MWFLIM GaAsP multi-spectral FLIM detectors. Data sheet, www.becker-hickl.com
7.
W. Becker, V. Shcheslavskiy, Fluorescence
Lifetime Imaging with Near-Infrared Dyes. Proc. SPIE 8588 (2013)
8.
J. Stadler. T. Schmid, R. Zenobi, Nanoscale
chemical imaging using top-illumination tip-enhancement Raman spectroscopy.
Nano Letters 10, 4514-4520 (2010)
Contact: Wolfgang Becker,
becker@becker-hickl.com