Principles
Personalized Chemotherapy
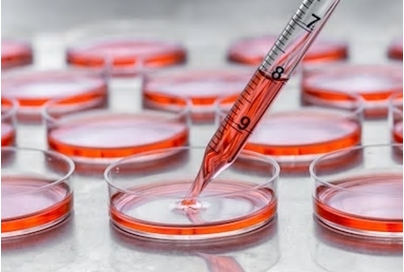
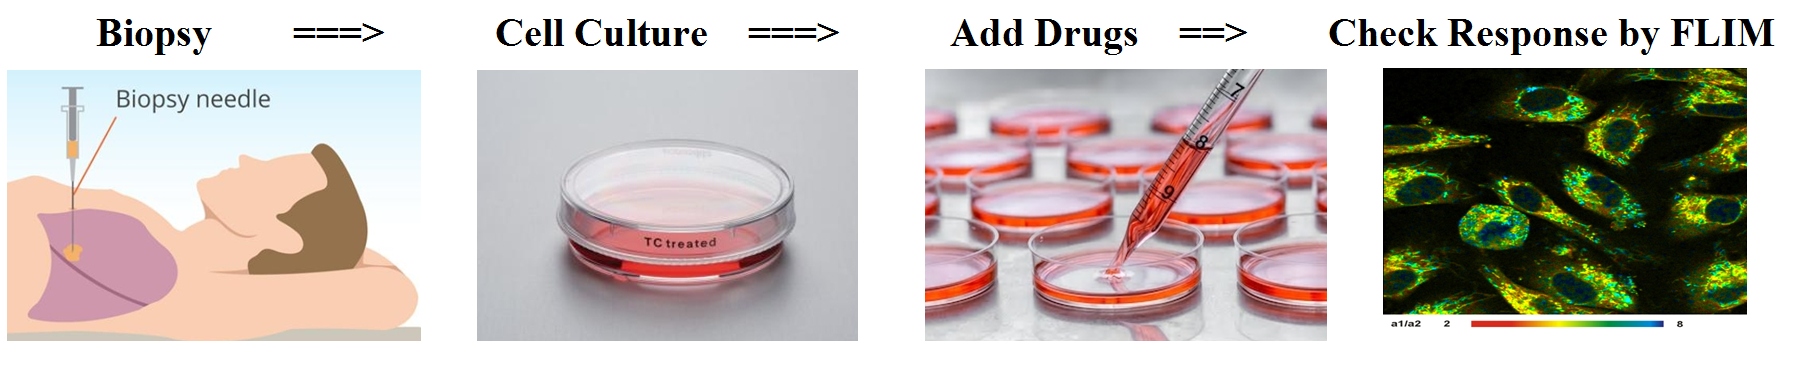
The response of cancer cells to different anti-cancer drugs is not entirely predictable. A method to target the chemotherapy to the special type of cancer a patient is suffering from has been developed by Skala and Walsh. A biopsy is taken and cells from the biopsy are cultered. The cell cultures are then treated with different drugs, and repeatedly imaged by metabolic FLIM. Because FLIM shows early shifts in the metabolic state the most efficient drug can be determined within a few days, and a cancer treatment strategy for the patient be developed. Due to the dramatically increased efficiency of personalized chemotherapy the technique has the potential to revolutionize cancer treatment.
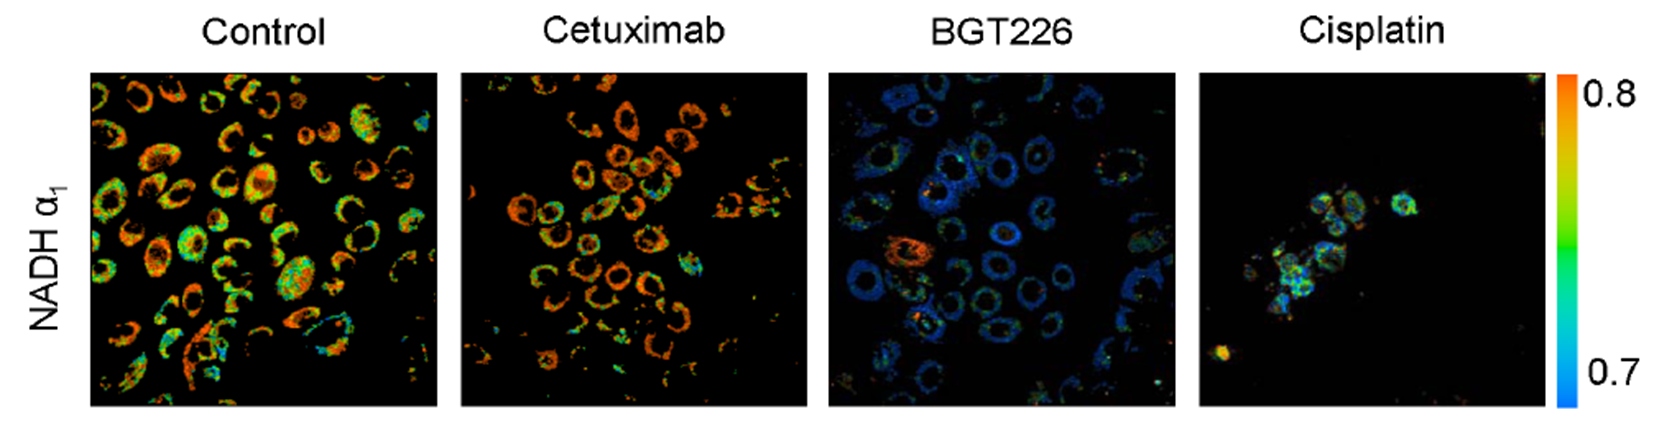
The row of NAD(P)H a1 (amplitude) images below show how cultured SCC25 cells responded to treatment with different drugs. There is no response to Cetuximab but a clear response to BGT226 and Cisplatin. The cells in the cultures treated with these two drugs have a1 values of about 0.7, as they are typical for normal cells.
For details please see:
J. Walsh, A. T. Shah, J. T. Sharick, M. C. Skala, Fluorescence lifetime measurements of NADH in live cells and tissue. In: W. Becker (ed.) Advanced time-correlated single photon counting applications. Springer, Berlin, Heidelberg, New York (2015)
References
References Related to Personalized Chemotherapy
- Walsh, R.C. Cook, B. Rexer, C.L. Arteaga, M.C. Skala, Optical Imaging of metabolism in HER2 overexpressing breast cancer cells. Biomedical Optics Express 3(1), 75-85 (2012)
- J. Walsh, R. S. Cook, H. C. Manning, D. J. Hicks, A. Lafontant, C. L. Arteaga, M. C. Skala, Optical Metabolic Imaging Identifies Glycolytic Levels, Subtypes, and Early-Treatment Response in Breast Cancer. Cancer Res. 73, 6164-6174 (2013)
- J. Walsh, R. S. Cook, M. E. Sanders, L. Aurisicchio, G. Ciliberto, C. L. Arteaga, M. C. Skala, Quantitative Optical Imaging of Primary Tumor Organoid Metabolism Predicts Drug Response in Breast Cancer. Cancer Res 74, OF1-OF11 (2014)
- J. Walsh, A. T. Shah, J. T. Sharick, M. C. Skala, Fluorescence Lifetime measurements of NADH in live cells and tissue. In: W. Becker (ed.) Advanced time-correlated single photon counting applications. Springer, Berlin, Heidelberg, New York (2015)
- J. Walsh, M. C. Skala, Optical metabolic imaging quantifies heterogeneous cell populations. Biomed. Opt. Expr. 6, 559-573 (2015)
- T. Shah, K.E. Diggins, A.J. Walsh, J. M. Irish, M.C, Skala, In vivo autofluorescence imaging of tumor heterogeneity in response to treatment. Neoplasia 17, 862-870 (2015)
- Amy T. Shah, Michelle Demory Beckler, Alex J. Walsh, William P. Jones, Paula R. Pohlmann, Melissa C. Skala, Optical Metabolic Imaging of Treatment Response in Human Head and Neck Squamous Cell Carcinoma. PLOS one 9, e90746 (2014)