Recording Z Scans
with the DCS‑120 Confocal Scanning FLIM System
Wolfgang Becker,
Stefan Smietana, Axel Bergmann, Becker & Hickl GmbH
Abstract.
The bh DCS‑120 FLIM system in the Zeiss Axio Observer Z1 version is able
to record Z stacks of FLIM images. The sample is scanned at a rate on the order
of 1 to 10 frames per second. The TCSPC system runs a series of measurement
cycles over specified periods of time while actively controlling the Z position
of the Axio Observer. After each measurement cycle the data are saved into a
file. The result is a number of FLIM data files for consecutive planes of the
sample.
Principle
The bh DCS‑120 confocal scanning FLIM
system [3] is based on the DCS‑120 scan head and bhs multidimensional TCSPC
technique [1, 2]. The scanner scans the sample at high pixel rate with a
high-repetition rate pulsed laser beam, the returned photons are detected in
two detector channels trough confocal pinholes, and recorded by two parallel bh
SPC‑150 TCSPC modules. The TCSPC modules build up photon distributions
over the time in the fluorescence decay, the image coordinates [4], and, if the MW-FLIM multi-spectral detectors
are used, the wavelength of the photons [5]. The photon distribution can either
be built up in the memory of the TCSPC module (Scan Sync In mode), or in the
memory of the computer (FIFO Imaging mode). The recording process does not
use any time gating or wavelength scanning and thus delivers a near-ideal detection
efficiency. The images can be acquired at scan rates as fast as 1 pixel per
microsecond. Subsequent frames of the scan are accumulated; the acquisition is
continued over as many frames as necessary to obtain an appropriate
signal-to-noise ratio. For bright samples acquisition times of less than one
second per image can be obtained [3, 6]. A DCS‑120 / Axio Observer system
is shown in Fig. 1.
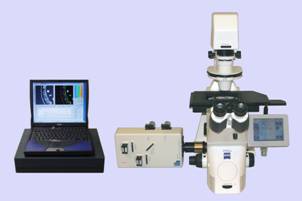
Fig. 1: DCS‑120
confocal scanning FLIM system, Axio Observer Z1 version
To obtain Z stacks with the TCSPC imaging
technique the measurement has to be repeated for subsequent planes of the
sample. Repetitive measurement can be achieved by the Cycle and Autosave
features of the SPCM operating software of the bh TCSPC modules [2]. In SPCM
version later than Aug. 2008 active control of the Zeiss Axio Observer Z1
microscope has been implemented [2, 3]. Obtaining Z stacks of FLIM images with
the DCS‑120 / Axio Observer Z1 systems is thus merely a matter of system
parameter setup.
System parameters for Z scanning
The measurement control section of the
system parameters is shown in Fig. 2. The setup for the Scan Sync In mode is
shown on the left, the setup for the FIFO imaging mode on the right.
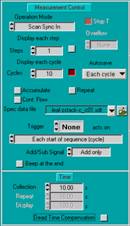
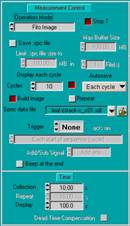
Fig. 2:
System parameters for Z-scanning. Left: Scan Sync In mode. Right: FIFO Imaging
Mode
Both setups record a series of 10 images at
10 consecutive Z positions. The images are saved into separate files. The
general file name is defined under Spec data file. The SPCM software extends
the file names with _C01 ... _C10 for the subsequent measurement cycles. The details of Z scanning are defined in a separate Z control panel,
see Fig. 3, left.
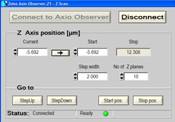
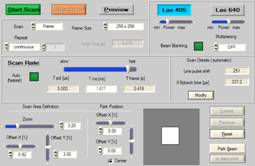
Fig. 3:
DCS-120 scanner setup. Left: Z scan parameters. Right: XY Scan parameters
The control panel shows the current Z position.
The position can be changed by typing in a new position, by clicking on the  symbols,
by clicking on the Step Up or Step Down buttons, or by turning the focusing
knob at the microscope. A click on
symbols,
by clicking on the Step Up or Step Down buttons, or by turning the focusing
knob at the microscope. A click on  defines the
current position as a start position of the Z scan. Step width an No of Z
planes define the distance and the number of Z steps. No of Z planes is
automatically connected to the Cycles in the system parameters, see Fig. 2.
defines the
current position as a start position of the Z scan. Step width an No of Z
planes define the distance and the number of Z steps. No of Z planes is
automatically connected to the Cycles in the system parameters, see Fig. 2.
X-Y scanning of the subsequent Z planes is controlled
via the ordinary scan parameters of the DCS‑120 scan head. The scanner
control panel is shown in Fig. 3, right. The scan format used is 256x256
pixels. Scan formats from 16x16 to 2048x2048 pixels are available; any of these
can be used. However, please note that the file sizes for large pixel numbers
can be enormous. A single recording cycle with 256 x 256 pixels
and 256 time channels in a dual-channel SPC system delivers
64 Megabytes. A Z stack of 16 such images produces one Gigabyte of data.
Increasing the pixel numbers may therefore be inappropriate. It should also be
noted that Z scanning causes an enormous load on the sample; photobleaching may
therefore preclude the use of extremely large image formats as well. A substantial
improvement has been obtained with the introduction of the bh PMH‑100-40
hybrid detector modules [3, 7].
These detectors are 5 to 10 times more sensitive than a conventional PMT. Thus,
images can be obtained at lower excitation power and correspondingly less
photobleaching.
To run a Z scan sequence, first start a scan
in the Preview mode. The Preview runs a fast scan and displays images in
intervals of one second. After choosing the location and the zoom of the scan,
change the Z position until you have found the Z plane you want to start with.
You can do this by turning the focusing knob at the microscope, or by changing
the position via the Z control panel. When you have found the right position,
define it as a start position. Switch off the preview, start the ordinary scan,
and start the measurement. The SPCM software will automatically record the
defined number of images at consecutive Z positions and save them into files.
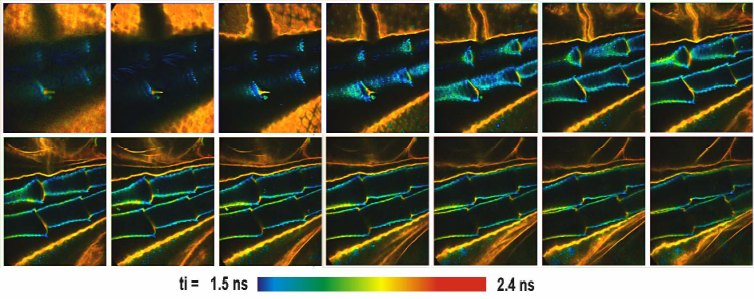
Two examples of Z scans are shown in Fig. 4
and Fig. 5. Both data sets were obtained in the FIFO Imaging mode, with 256x256
pixels and 256 time channels. The acquisition time per Z plane was
10 seconds, the average count rate about 106 photons/second.
The other setup parameters were as shown in Fig. 2 to Fig. 3.
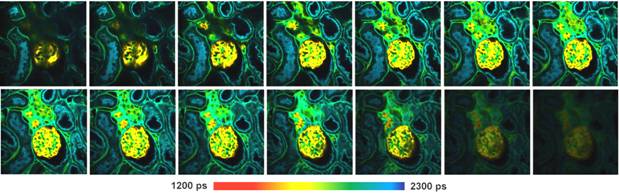
Fig. 4: Z stack recording of a mouse kidney section. Images 256x256
pixels, 256 time channels.14 steps in Z, step width 1.5 um. FIFO Imaging
mode, 256x256 pixels, 256 time channels. Setup data shown in Fig. 2 and Fig. 3.
Fig. 5: Z stack recording, part of a water flee, autofluorescence. Images
256x256 pixels, 256 time channels.15 steps in Z, step width 4 um. Zeiss
water C Apochromate, bh HPM‑100-40 hybrid detector.
Tips and Tricks
Changing between instrument configurations
The DCS‑120 system can be used to
record single and dual-wavelength FLIM data, multi-wavelength FLIM data,
time-series and Z series of FLIM data, and FCS data. To easily change between
different modes and configurations we recommend to put the corresponding system
setup files into the list of Predefined Setups. Changing between different
instrument configurations is then a matter of a single mouse click [2, 3].
Multi-File View
For measurements that deliver a series of
FLIM data files it may be required to quickly switch through the corresponding
images. For this purpose, the SPCM software has a Multi-file View function
implemented. A series of FLIM data files is specified, and individual images are
selected and displayed on a mouse click. Moreover, the Multi-File View is able
to switch through series of data files consecutively, displaying the images
like a movie. Please see [2] for details.
Analysis of multi-dimensional FLIM data
Analysing Z series or time series of FLIM
recordings image by image can be troublesome. bh has therefore developed a new
FLIM data analysis software. The bh OPTISPEC software especially addresses the
sequential and multi-dimensional recording features of the bh TCSPC technique.
It not only analyses single FLIM data sets, but also multi-wavelength FLIM
data, time series of FLIM measurements, or Z stacks of FLIM measurements. For
multidimensional data sets, OPTISPEC allows the user to fit a global model to
the entire data array. By defining parameters as global, correlations of fit
parameters between different pixels, different wavelength intervals, or
different steps of a time series can be exploited. The OPTISPEC software is
described in a separate handbook [8].
References
1.
W. Becker, Advanced time-correlated single-photon counting techniques. Springer, Berlin,
Heidelberg, New York, 2005
2.
W. Becker, The bh TCSPC handbook, 3rd edition. Becker
& Hickl GmbH (2008), www.becker-hickl.com
3.
Becker & Hickl GmbH, DCS-120 Confocal
Scanning FLIM Systems, user handbook. www.becker-hickl.com
4. W. Becker, A. Bergmann, M.A. Hink, K. König, K. Benndorf, C. Biskup,
Fluorescence lifetime imaging by time-correlated single photon counting, Micr.
Res. Techn. 63, 58-66 (2004)
5. W. Becker, A. Bergmann, C. Biskup, Multi-Spectral Fluorescence
Lifetime Imaging by TCSPC. Micr. Res. Tech. 70,
403-409 (2007)
6.
V. Katsoulidou, A. Bergmann, W. Becker, How fast
can TCSPC FLIM be made? Proc. SPIE 6771, 67710B-1 to 67710B-7
7.
The HPM‑100-40 hybrid detector. Application
note, available on www.becker-hickl.com
8.
Becker & Hickl GmbH, Optispec Data
Analysis Software. User manual. Available on www.becker-hickl.com